Quest Diagnostics 2012 Annual Report Download - page 100
Download and view the complete annual report
Please find page 100 of the 2012 Quest Diagnostics annual report below. You can navigate through the pages in the report by either clicking on the pages listed below, or by using the keyword search tool below to find specific information within the annual report.-
 1
1 -
2
-
3
-
4
-
5
-
6
-
7
-
8
-
9
-
10
-
11
-
12
-
13
-
14
-
15
-
16
-
17
-
18
-
19
-
20
-
21
-
22
-
23
-
24
-
25
-
26
-
27
-
28
-
29
-
30
-
31
-
32
-
33
-
34
-
35
-
36
-
37
-
38
-
39
-
40
-
41
-
42
-
43
-
44
-
45
-
46
-
47
-
48
-
49
-
50
-
51
-
52
-
53
-
54
-
55
-
56
-
57
-
58
-
59
-
60
-
61
-
62
-
63
-
64
-
65
-
66
-
67
-
68
-
69
-
70
-
71
-
72
-
73
-
74
-
75
-
76
-
77
-
78
-
79
-
80
-
81
-
82
-
83
-
84
-
85
-
86
-
87
-
88
-
89
-
 90
90 -
 91
91 -
 92
92 -
 93
93 -
 94
94 -
 95
95 -
 96
96 -
 97
97 -
 98
98 -
 99
99 -
 100
100 -
 101
101 -
 102
102 -
 103
103 -
 104
104 -
 105
105 -
 106
106 -
 107
107 -
 108
108 -
 109
109 -
 110
110 -
111
-
112
-
113
-
114
-
115
-
116
-
117
-
118
-
119
-
120
-
121
-
122
-
123
-
124
-
125
-
126
 |
 |

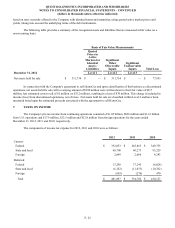
F- 27
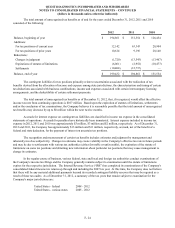
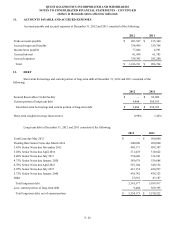
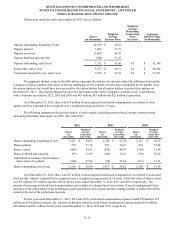
Intangible assets at December 31, 2012 and 2011 consisted of the following:
Weighted
Average
Amortization
Period
(Years) December 31, 2012 December 31, 2011
Cost
Accumulated
Amortization Net Cost
Accumulated
Amortization Net
Amortizing intangible assets:
Customer-related
intangibles 19 $ 566,701 $ (173,516) $ 393,185 $ 630,671 $ (193,131) $ 437,540
Non-compete
agreements 4 38,551 (17,123) 21,428 45,798 (14,633) 31,165
Technology 14 131,040 (25,144) 105,896 165,113 (27,929) 137,184
Other 8 141,818 (37,634) 104,184 146,613 (23,552) 123,061
Total 16 878,110 (253,417) 624,693 988,195 (259,245) 728,950
Intangible assets not subject to amortization:
Tradenames 246,200 — 246,200 300,648 — 300,648
In-process research
and development 120 — 120 5,250 — 5,250
Other 1,159 — 1,159 764 — 764
Total intangible
assets $1,125,589 $ (253,417) $ 872,172 $1,294,857 $ (259,245) $1,035,612
Amortization expense related to intangible assets was $75 million, $61 million and $33 million for the years ended
December 31, 2012, 2011 and 2010, respectively.
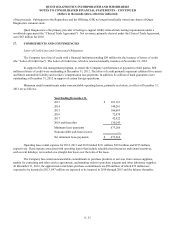
The estimated amortization expense related to amortizable intangible assets for each of the five succeeding fiscal years
and thereafter as of December 31, 2012 is as follows:
Year Ending December 31,
2013 $ 72,979
2014 70,817
2015 59,552
2016 52,842
2017 49,088
Thereafter 319,415
Total $ 624,693
In December 2012, $219 million of goodwill and $111 million of intangible assets, net were reclassified to non-current
assets held for sale in the Consolidated Balance Sheet. For further discussion see Note 18.
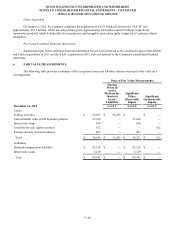
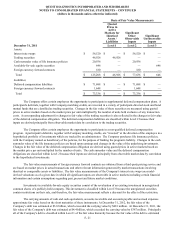
QUEST DIAGNOSTICS INCORPORATED AND SUBSIDIARIES
NOTES TO CONSOLIDATED FINANCIAL STATEMENTS – CONTINUED
(dollars in thousands unless otherwise indicated)