Quest Diagnostics 2012 Annual Report Download - page 65
Download and view the complete annual report
Please find page 65 of the 2012 Quest Diagnostics annual report below. You can navigate through the pages in the report by either clicking on the pages listed below, or by using the keyword search tool below to find specific information within the annual report.-
 1
1 -
2
-
3
-
4
-
5
-
6
-
7
-
8
-
9
-
10
-
11
-
12
-
13
-
14
-
15
-
16
-
17
-
18
-
19
-
20
-
21
-
22
-
23
-
24
-
25
-
26
-
27
-
28
-
29
-
30
-
31
-
32
-
33
-
34
-
35
-
36
-
37
-
38
-
39
-
40
-
41
-
42
-
43
-
44
-
45
-
46
-
47
-
48
-
49
-
50
-
51
-
52
-
53
-
54
-
 55
55 -
 56
56 -
 57
57 -
 58
58 -
 59
59 -
 60
60 -
 61
61 -
 62
62 -
 63
63 -
 64
64 -
 65
65 -
 66
66 -
 67
67 -
 68
68 -
 69
69 -
 70
70 -
 71
71 -
 72
72 -
 73
73 -
 74
74 -
 75
75 -
76
-
77
-
78
-
79
-
80
-
81
-
82
-
83
-
84
-
85
-
86
-
87
-
88
-
89
-
90
-
91
-
92
-
93
-
94
-
95
-
96
-
97
-
98
-
99
-
100
-
101
-
102
-
103
-
104
-
105
-
106
-
107
-
108
-
109
-
110
-
111
-
112
-
113
-
114
-
115
-
116
-
117
-
118
-
119
-
120
-
121
-
122
-
123
-
124
-
125
-
126
 |
 |

62
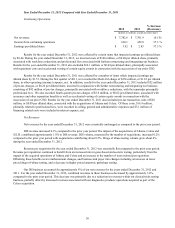
Results for the year ended December 31, 2010 included pre-tax charges, principally associated with workforce
reductions, of $26.8 million ($6.3 million in cost of services and $20.5 million in selling, general and administrative expenses).
In addition, other operating (income) expense, net for the year ended December 31, 2010 included a $9.6 million fourth quarter
pre-tax charge associated with the settlement of employment litigation.
Also, year-over-year comparisons of operating expenses were favorably impacted by approximately $5.4 million,
associated with gains and losses on investments in our supplemental deferred compensation plans. Results for the year ended
December 31, 2011 and 2010 included an increase in operating costs of $0.3 million and $5.7 million, respectively,
representing increases in the deferred compensation obligation to reflect investment gains earned by employees participating in
our deferred compensation plans.
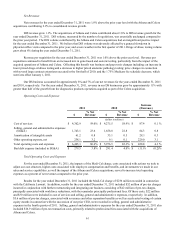
Cost of Services
The increase in cost of services as a percentage of revenues for the year ended December 31, 2011 compared to the
prior year reflects the impact of actions we took to reduce our cost structure and the acquired operations of Athena and Celera,
which served to reduce the percentage. These improvements were offset by the impact of a $15.9 million increase in pre-tax
charges, primarily associated with restructuring and integration activities, higher costs associated with employee compensation
and benefits, and investments we made in service capabilities.
Selling, General and Administrative Expenses
The increase in selling, general and administrative expenses as a percentage of net revenues for the year ended
December 31, 2011 compared to the prior year primarily reflects a $9.4 million increase in pre-tax charges, primarily associated
with restructuring and integration activities, costs incurred in connection with the succession of our prior CEO, higher costs
associated with employee compensation and benefits, and investments we made in our sales force. In addition, selling, general
and administrative expenses for the year ended December 31, 2011 included pre-tax transaction costs of $16.9 million,
primarily related to professional fees associated with the acquisitions of Athena and Celera. These increases were partially
offset by actions we took to reduce our cost structure and an improvement in bad debt expense as a percentage of net revenues,
primarily reflecting continued strong performance in our billing operations and collection metrics.
Amortization of Intangible Assets
The increase in amortization of intangible assets for the year ended December 31, 2011 compared to the prior year
reflects the impact of amortization of intangible assets acquired as part of the Athena and Celera acquisitions.
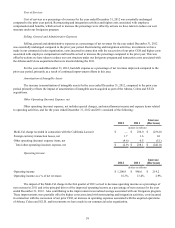
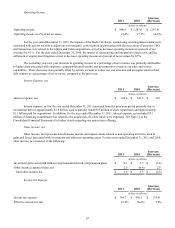
Other Operating (Income) Expense, net
Other operating (income) expense, net includes special charges, and miscellaneous income and expense items related
to operating activities, and for the years ended December 31, 2011 and 2010 consisted of the following:
Increase
(Decrease)2011 2010
(dollars in millions)
Medi-Cal charge recorded in connection with the California Lawsuit $ 236.0 $ — $ 236.0
Settlement of employment litigation — 9.6 (9.6)
Foreign currency transaction losses, net 1.6 1.7 (0.1)
Other operating expense (income) items, net 0.5 (2.3) 2.8
Total other operating expense, net $ 238.1 $ 9.0 $ 229.1