Quest Diagnostics 2012 Annual Report Download - page 78
Download and view the complete annual report
Please find page 78 of the 2012 Quest Diagnostics annual report below. You can navigate through the pages in the report by either clicking on the pages listed below, or by using the keyword search tool below to find specific information within the annual report.-
 1
1 -
2
-
3
-
4
-
5
-
6
-
7
-
8
-
9
-
10
-
11
-
12
-
13
-
14
-
15
-
16
-
17
-
18
-
19
-
20
-
21
-
22
-
23
-
24
-
25
-
26
-
27
-
28
-
29
-
30
-
31
-
32
-
33
-
34
-
35
-
36
-
37
-
38
-
39
-
40
-
41
-
42
-
43
-
44
-
45
-
46
-
47
-
48
-
49
-
50
-
51
-
52
-
53
-
54
-
55
-
56
-
57
-
58
-
59
-
60
-
61
-
62
-
63
-
64
-
65
-
66
-
67
-
 68
68 -
 69
69 -
 70
70 -
 71
71 -
 72
72 -
 73
73 -
 74
74 -
 75
75 -
 76
76 -
 77
77 -
 78
78 -
 79
79 -
 80
80 -
 81
81 -
 82
82 -
 83
83 -
 84
84 -
 85
85 -
 86
86 -
 87
87 -
 88
88 -
89
-
90
-
91
-
92
-
93
-
94
-
95
-
96
-
97
-
98
-
99
-
100
-
101
-
102
-
103
-
104
-
105
-
106
-
107
-
108
-
109
-
110
-
111
-
112
-
113
-
114
-
115
-
116
-
117
-
118
-
119
-
120
-
121
-
122
-
123
-
124
-
125
-
126
 |
 |

F- 5
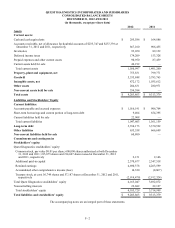
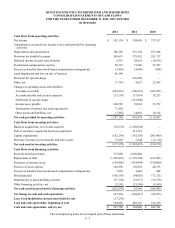
QUEST DIAGNOSTICS INCORPORATED AND SUBSIDIARIES
CONSOLIDATED STATEMENTS OF CASH FLOWS
FOR THE YEARS ENDED DECEMBER 31, 2012, 2011 AND 2010
(in thousands)
2012 2011 2010
Cash flows from operating activities:
Net income $ 592,134 $ 505,650 $ 757,017
Adjustments to reconcile net income to net cash provided by operating
activities:
Depreciation and amortization 286,596 281,102 253,964
Provision for doubtful accounts 268,615 279,592 291,737
Deferred income tax provision (benefit) 6,535 28,624 (18,878)
Stock-based compensation expense 50,332 71,906 53,927
Excess tax benefits from stock-based compensation arrangements (3,956)(4,466)(884)
Asset impairment and loss on sale of business 86,348 — —
Provision for special charge — 236,000 —
Other, net (7,781) 8,627 22,967
Changes in operating assets and liabilities:
Accounts receivable (243,019)(306,652)(309,932)
Accounts payable and accrued expenses (13,156)(17,636) 18,235
Settlement of special charge — (241,000)—
Income taxes payable 100,585 39,062 33,732
Termination of interest rate swap agreements 71,820 — —
Other assets and liabilities, net (7,885) 14,665 16,162
Net cash provided by operating activities 1,187,168 895,474 1,118,047
Cash flows from investing activities:
Business acquisitions, net of cash acquired (50,574)(1,298,624)—
Sale of securities acquired in business acquisition — 213,541 —
Capital expenditures (182,234)(161,556)(205,400)
Decrease (increase) in investments and other assets 15,669 3,204 (11,110)
Net cash used in investing activities (217,139)(1,243,435)(216,510)
Cash flows from financing activities:
Proceeds from borrowings 715,000 2,689,406 —
Repayments of debt (1,369,410)(1,710,308)(169,491)
Purchases of treasury stock (199,996)(934,994)(750,000)
Exercise of stock options 162,096 136,818 48,535
Excess tax benefits from stock-based compensation arrangements 3,956 4,466 884
Dividends paid (108,136)(64,662)(71,321)
Distributions to noncontrolling interests (37,794)(35,671)(36,739)
Other financing activities, net 12,189 (21,509)(8,360)
Net cash (used in) provided by financing activities (822,095) 63,546 (986,492)
Net change in cash and cash equivalents 147,934 (284,415)(84,955)
Less: Cash included in current assets held for sale (17,234)— —
Cash and cash equivalents, beginning of year 164,886 449,301 534,256
Cash and cash equivalents, end of year $ 295,586 $ 164,886 $ 449,301
The accompanying notes are an integral part of these statements.