Quest Diagnostics 2012 Annual Report Download - page 105
Download and view the complete annual report
Please find page 105 of the 2012 Quest Diagnostics annual report below. You can navigate through the pages in the report by either clicking on the pages listed below, or by using the keyword search tool below to find specific information within the annual report.-
 1
1 -
2
-
3
-
4
-
5
-
6
-
7
-
8
-
9
-
10
-
11
-
12
-
13
-
14
-
15
-
16
-
17
-
18
-
19
-
20
-
21
-
22
-
23
-
24
-
25
-
26
-
27
-
28
-
29
-
30
-
31
-
32
-
33
-
34
-
35
-
36
-
37
-
38
-
39
-
40
-
41
-
42
-
43
-
44
-
45
-
46
-
47
-
48
-
49
-
50
-
51
-
52
-
53
-
54
-
55
-
56
-
57
-
58
-
59
-
60
-
61
-
62
-
63
-
64
-
65
-
66
-
67
-
68
-
69
-
70
-
71
-
72
-
73
-
74
-
75
-
76
-
77
-
78
-
79
-
80
-
81
-
82
-
83
-
84
-
85
-
86
-
87
-
88
-
89
-
90
-
91
-
92
-
93
-
94
-
 95
95 -
 96
96 -
 97
97 -
 98
98 -
 99
99 -
 100
100 -
 101
101 -
 102
102 -
 103
103 -
 104
104 -
 105
105 -
 106
106 -
 107
107 -
 108
108 -
 109
109 -
 110
110 -
 111
111 -
 112
112 -
 113
113 -
 114
114 -
 115
115 -
116
-
117
-
118
-
119
-
120
-
121
-
122
-
123
-
124
-
125
-
126
 |
 |

F- 32
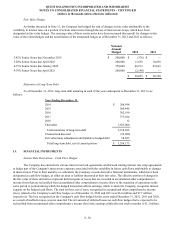
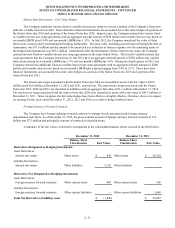
14. PREFERRED STOCK AND COMMON STOCKHOLDERS’ EQUITY
Series Preferred Stock
Quest Diagnostics is authorized to issue up to 10 million shares of Series Preferred Stock, par value $1.00 per share.
The Company's Board of Directors has the authority to issue such shares without stockholder approval and to determine the
designations, preferences, rights and restrictions of such shares. Of the authorized shares, 1.3 million shares have been
designated Series A Preferred Stock. No shares are currently outstanding.
Common Stock
On May 4, 2006, the Company's Restated Certificate of Incorporation was amended to increase the number of
authorized shares of common stock, par value $0.01 per share, from 300 million shares to 600 million shares.
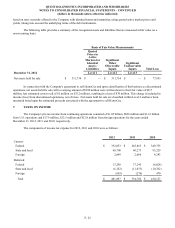
Accumulated Other Comprehensive Income (Loss)
The components of accumulated other comprehensive income (loss) for 2012, 2011 and 2010 were as follows:
Foreign
Currency
Translation
Adjustment
Market Value
Adjustment
Deferred
Loss
Accumulated
Other
Comprehensive
Income (Loss)
Balance, December 31, 2009 $ (13,408)$ (216)$ (7,337)$ (20,961)
Currency translation 27,271 — — 27,271
Market valuation, net of tax — 3,090 — 3,090
Net deferred loss on cash flow hedges, net of tax — — 724 724
Other — 502 — 502
Balance, December 31, 2010 13,863 3,376 (6,613) 10,626
Currency translation (12,920)——
(12,920)
Market valuation, net of tax — (2,696)— (2,696)
Net deferred loss on cash flow hedges, net of tax — — (1,042)(1,042)
Other — (2,035)— (2,035)
Balance, December 31, 2011 943 (1,355)(7,655)(8,067)
Currency translation 24,520 — — 24,520
Market valuation, net of tax — (20)— (20)
Net deferred loss on cash flow hedges, net of tax — — 838 838
Other — (2,951)— (2,951)
Balance, December 31, 2012 $ 25,463 $ (4,326)$ (6,817) $ 14,320
The market valuation adjustments represent unrealized holding gains (losses) on available-for-sale securities, net of
taxes. The net deferred loss on cash flow hedges represents deferred losses on the Company’s interest rate related derivative
financial instruments designated as cash flow hedges, net of amounts reclassified to interest expense (see Note 13). For the
years ended December 31, 2012, 2011 and 2010, the tax effects related to the market valuation adjustments and deferred losses
were not material. Foreign currency translation adjustments are not adjusted for income taxes since they relate to indefinite
investments in non-U.S. subsidiaries.
QUEST DIAGNOSTICS INCORPORATED AND SUBSIDIARIES
NOTES TO CONSOLIDATED FINANCIAL STATEMENTS – CONTINUED
(dollars in thousands unless otherwise indicated)