Quest Diagnostics 2012 Annual Report Download - page 108
Download and view the complete annual report
Please find page 108 of the 2012 Quest Diagnostics annual report below. You can navigate through the pages in the report by either clicking on the pages listed below, or by using the keyword search tool below to find specific information within the annual report.-
 1
1 -
2
-
3
-
4
-
5
-
6
-
7
-
8
-
9
-
10
-
11
-
12
-
13
-
14
-
15
-
16
-
17
-
18
-
19
-
20
-
21
-
22
-
23
-
24
-
25
-
26
-
27
-
28
-
29
-
30
-
31
-
32
-
33
-
34
-
35
-
36
-
37
-
38
-
39
-
40
-
41
-
42
-
43
-
44
-
45
-
46
-
47
-
48
-
49
-
50
-
51
-
52
-
53
-
54
-
55
-
56
-
57
-
58
-
59
-
60
-
61
-
62
-
63
-
64
-
65
-
66
-
67
-
68
-
69
-
70
-
71
-
72
-
73
-
74
-
75
-
76
-
77
-
78
-
79
-
80
-
81
-
82
-
83
-
84
-
85
-
86
-
87
-
88
-
89
-
90
-
91
-
92
-
93
-
94
-
95
-
96
-
97
-
 98
98 -
 99
99 -
 100
100 -
 101
101 -
 102
102 -
 103
103 -
 104
104 -
 105
105 -
 106
106 -
 107
107 -
 108
108 -
 109
109 -
 110
110 -
 111
111 -
 112
112 -
 113
113 -
 114
114 -
 115
115 -
 116
116 -
 117
117 -
 118
118 -
119
-
120
-
121
-
122
-
123
-
124
-
125
-
126
 |
 |

F- 35
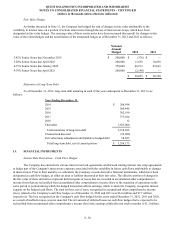
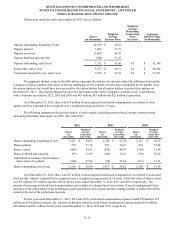
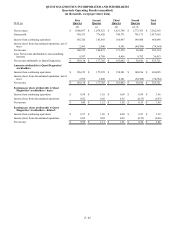
Transactions under the stock option plans for 2012 were as follows:
Shares
(in thousands)
Weighted
Average
Exercise Price
Weighted
Average
Remaining
Contractual
Ter m
(in years)
Aggregate
Intrinsic Value
(in thousands)
Options outstanding, beginning of year 10,309 $ 49.16
Options granted 1,409 57.71
Options exercised (3,467) 46.76
Options forfeited and canceled (500) 51.47
Options outstanding, end of year 7,751 $ 51.68 5.0 $ 51,146
Exercisable, end of year 5,537 $ 49.51 2.4 $ 48,564
Vested and expected to vest, end of year 7,676 $ 51.63 5.0 $ 51,071
The aggregate intrinsic value in the table above represents the total pre-tax intrinsic value (the difference between the
Company's closing common stock price on the last trading day of 2012 and the exercise price, multiplied by the number of in-
the-money options) that would have been received by the option holders had all option holders exercised their options on
December 31, 2012. This amount changes based on the fair market value of the Company's common stock. Total intrinsic
value of options exercised in 2012, 2011 and 2010 was $45 million, $43 million and $22 million, respectively.
As of December 31, 2012, there was $10 million of unrecognized stock-based compensation cost related to stock
options which is expected to be recognized over a weighted average period of 1.9 years.
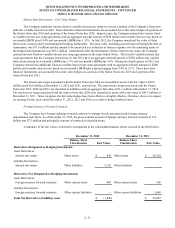
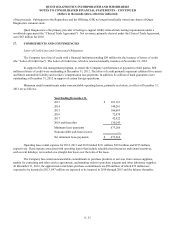
The following summarizes the activity relative to stock awards, including restricted stock awards, restricted stock
units and performance share units, for 2012, 2011 and 2010:
2012 2011 2010
Shares
(in
thousands)
Weighted
Average
Grant Date
Fair Value
Shares
(in
thousands)
Weighted
Average
Grant Date
Fair Value
Shares
(in
thousands)
Weighted
Average
Grant Date
Fair Value
Shares outstanding, beginning of year 1,957 $ 54.61 2,140 $ 51.54 2,747 $ 50.27
Shares granted 779 57.78 877 56.81 876 55.44
Shares vested (899) 52.62 (930) 48.93 (742) 51.48
Shares forfeited and canceled (97) 57.09 (100) 55.47 (130) 52.34
Adjustment to estimate of performance
share units to be earned (544) 57.06 (30) 53.23 (611) 51.33
Shares outstanding, end of year 1,196 $ 56.84 1,957 $ 54.61 2,140 $ 51.54
As of December 31, 2012, there was $21 million of unrecognized stock-based compensation cost related to nonvested
stock awards, which is expected to be recognized over a weighted average period of 1.8 years. Total fair value of shares vested
was $53 million, $53 million and $41 million for the years ended December 31, 2012, 2011 and 2010, respectively. The
amount of unrecognized stock-based compensation cost is subject to change based on revisions, if any, to management's best
estimates of the achievement of the performance goals specified in such awards and the resulting number of shares that will be
earned at the end of the performance periods.
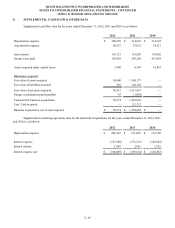
For the years ended December 31, 2012, 2011 and 2010, stock-based compensation expense totaled $50 million, $72
million and $54 million, respectively. Income tax benefits related to stock-based compensation expense totaled $19 million,
$28 million and $21 million for the years ended December 31, 2012, 2011 and 2010, respectively.
QUEST DIAGNOSTICS INCORPORATED AND SUBSIDIARIES
NOTES TO CONSOLIDATED FINANCIAL STATEMENTS – CONTINUED
(dollars in thousands unless otherwise indicated)