Quest Diagnostics 2012 Annual Report Download - page 96
Download and view the complete annual report
Please find page 96 of the 2012 Quest Diagnostics annual report below. You can navigate through the pages in the report by either clicking on the pages listed below, or by using the keyword search tool below to find specific information within the annual report.-
 1
1 -
2
-
3
-
4
-
5
-
6
-
7
-
8
-
9
-
10
-
11
-
12
-
13
-
14
-
15
-
16
-
17
-
18
-
19
-
20
-
21
-
22
-
23
-
24
-
25
-
26
-
27
-
28
-
29
-
30
-
31
-
32
-
33
-
34
-
35
-
36
-
37
-
38
-
39
-
40
-
41
-
42
-
43
-
44
-
45
-
46
-
47
-
48
-
49
-
50
-
51
-
52
-
53
-
54
-
55
-
56
-
57
-
58
-
59
-
60
-
61
-
62
-
63
-
64
-
65
-
66
-
67
-
68
-
69
-
70
-
71
-
72
-
73
-
74
-
75
-
76
-
77
-
78
-
79
-
80
-
81
-
82
-
83
-
84
-
85
-
 86
86 -
 87
87 -
 88
88 -
 89
89 -
 90
90 -
 91
91 -
 92
92 -
 93
93 -
 94
94 -
 95
95 -
 96
96 -
 97
97 -
 98
98 -
 99
99 -
 100
100 -
 101
101 -
 102
102 -
 103
103 -
 104
104 -
 105
105 -
 106
106 -
107
-
108
-
109
-
110
-
111
-
112
-
113
-
114
-
115
-
116
-
117
-
118
-
119
-
120
-
121
-
122
-
123
-
124
-
125
-
126
 |
 |

F- 23
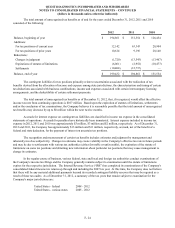
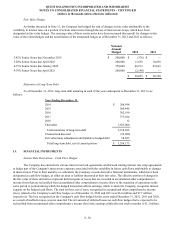
A reconciliation of the federal statutory rate to the Company's effective tax rate for 2012, 2011 and 2010 was as
follows:
2012 2011 2010
Tax provision at statutory rate 35.0% 35.0% 35.0%
State and local income taxes, net of federal benefit 3.4 3.7 4.0
Impact of foreign operations (0.3)— —
Tax credits (0.2)(0.5)(0.3)
Charge associated with settlement of certain legal claims (see Note 17), a
portion for which a tax benefit has not been recorded — 5.2 —
Transaction costs associated with business acquisitions (see Note 5), a
portion for which a tax benefit has not been recorded — 0.3 —
Non-deductible expenses, primarily meals and entertainment expenses 0.3 0.3 0.2
Impact of noncontrolling interests (1.3)(1.2)(1.2)
Other, net 0.7 (1.0)(1.1)
Effective tax rate 37.6% 41.8% 36.6%
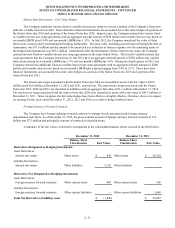
The tax effects of temporary differences that give rise to significant portions of the deferred tax assets (liabilities) at
December 31, 2012 and 2011 were as follows:
2012 2011
Current deferred tax assets:
Accounts receivable reserves $ 90,784 $ 85,485
Liabilities not currently deductible 83,425 67,843
Total current deferred tax assets $ 174,209 $ 153,328
Non-current deferred tax assets (liabilities):
Liabilities not currently deductible $ 139,869 $ 151,621
Stock-based compensation 58,253 72,262
Capitalized R&D expense 10,413 16,899
Net operating loss carryforwards, net of valuation allowance 104,257 121,234
Depreciation and amortization (484,773)(528,129)
Total non-current deferred tax liabilities, net $ (171,981)$ (166,113)
At December 31, 2012 and 2011, non-current deferred tax assets of $15 million and $18 million, respectively, are
recorded in other long-term assets in the consolidated balance sheet. At December 31, 2012 and 2011, non-current deferred tax
liabilities of $187 million and $184 million, respectively, are included in other long-term liabilities in the consolidated balance
sheet.
As of December 31, 2012, the Company had estimated net operating loss carryforwards for federal and state income
tax purposes of $188 million and $987 million, respectively, which expire at various dates through 2032. Estimated net
operating loss carryforwards for foreign income tax purposes are $49 million at December 31, 2012, some of which can be
carried forward indefinitely while others expire at various dates through 2023. As of December 31, 2012 and 2011, deferred tax
assets associated with net operating loss carryforwards of $137 million and $152 million, respectively, have each been reduced
by a valuation allowance of $32 million and $31 million, respectively.
Income taxes payable including those classified in other long-term liabilities in the consolidated balance sheets at
December 31, 2012 and 2011, were $251 million and $164 million, respectively.
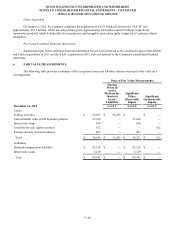
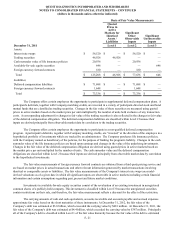
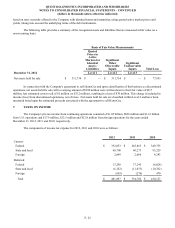
QUEST DIAGNOSTICS INCORPORATED AND SUBSIDIARIES
NOTES TO CONSOLIDATED FINANCIAL STATEMENTS – CONTINUED
(dollars in thousands unless otherwise indicated)