Quest Diagnostics 2012 Annual Report Download - page 47
Download and view the complete annual report
Please find page 47 of the 2012 Quest Diagnostics annual report below. You can navigate through the pages in the report by either clicking on the pages listed below, or by using the keyword search tool below to find specific information within the annual report.-
 1
1 -
2
-
3
-
4
-
5
-
6
-
7
-
8
-
9
-
10
-
11
-
12
-
13
-
14
-
15
-
16
-
17
-
18
-
19
-
20
-
21
-
22
-
23
-
24
-
25
-
26
-
27
-
28
-
29
-
30
-
31
-
32
-
33
-
34
-
35
-
36
-
 37
37 -
 38
38 -
 39
39 -
 40
40 -
 41
41 -
 42
42 -
 43
43 -
 44
44 -
 45
45 -
 46
46 -
 47
47 -
 48
48 -
 49
49 -
 50
50 -
 51
51 -
 52
52 -
 53
53 -
 54
54 -
 55
55 -
 56
56 -
 57
57 -
58
-
59
-
60
-
61
-
62
-
63
-
64
-
65
-
66
-
67
-
68
-
69
-
70
-
71
-
72
-
73
-
74
-
75
-
76
-
77
-
78
-
79
-
80
-
81
-
82
-
83
-
84
-
85
-
86
-
87
-
88
-
89
-
90
-
91
-
92
-
93
-
94
-
95
-
96
-
97
-
98
-
99
-
100
-
101
-
102
-
103
-
104
-
105
-
106
-
107
-
108
-
109
-
110
-
111
-
112
-
113
-
114
-
115
-
116
-
117
-
118
-
119
-
120
-
121
-
122
-
123
-
124
-
125
-
126
 |
 |

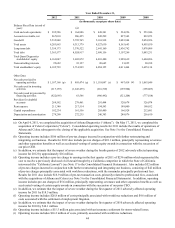
44
Year Ended December 31,
2012 2011 2010 2009 2008
(in thousands, except per share data)
Balance Sheet Data (at end of
year): (a)
Cash and cash equivalents $ 295,586 $ 164,886 $ 449,301 $ 534,256 $ 253,946
Accounts receivable, net 867,010 906,455 845,299 827,343 832,873
Goodwill 5,535,848 5,795,765 5,101,938 5,083,944 5,054,926
Total assets 9,283,863 9,313,379 8,527,630 8,563,643 8,403,830
Long-term debt 3,354,173 3,370,522 2,641,160 2,936,792 3,078,089
Total debt 3,363,577 4,024,917 2,990,156 3,107,299 3,083,231
Total Quest Diagnostics
stockholders' equity 4,163,047 3,692,872 4,033,480 3,989,639 3,604,896
Noncontrolling interests 22,682 22,127 20,645 21,825 20,238
Total stockholders' equity 4,185,729 3,714,999 4,054,125 4,011,464 3,625,134
Other Data:
Net cash provided by
operating activities $ 1,187,168 (p) $ 895,474 (q) $ 1,118,047 (r) $ 997,418 (s) $ 1,063,049
Net cash used in investing
activities (217,139) (1,243,435) (216,510) (195,904) (198,883)
Net cash (used in) provided by
financing activities (822,095) 63,546 (986,492) (521,204) (777,814)
Provision for doubtful
accounts 268,592 279,461 291,444 320,678 326,074
Rent expense 211,340 217,514 194,593 188,000 190,012
Capital expenditures 182,234 161,556 205,400 166,928 212,681
Depreciation and amortization 278,290 272,235 246,303 248,876 256,610
(a) On April 4, 2011, we completed the acquisition of Athena Diagnostics (“Athena”). On May 17, 2011, we completed the
acquisition of Celera Corporation (“Celera”). Consolidated operating results for 2011 include the results of operations of
Athena and Celera subsequent to the closing of the applicable acquisition. See Note 5 to the Consolidated Financial
Statements.
(b) Operating income includes $106 million of pre-tax charges incurred in conjunction with further restructuring and
integrating our business. Results for 2012 also include pre-tax charges of $10.1 million, principally representing severance
and other separation benefits as well as accelerated vesting of certain equity awards in connection with the succession of
our prior CEO.
(c) In addition, we estimate that the impact of severe weather during the fourth quarter of 2012 adversely affected operating
income for 2012 by approximately $16 million.
(d) Operating income includes a pre-tax charge to earnings in the first quarter of 2011 of $236 million which represented the
cost to resolve a previously disclosed civil lawsuit brought by a California competitor in which the State of California
intervened (the “California Lawsuit”) (see Note 17 to the Consolidated Financial Statements). Also includes $52 million
of pre-tax charges incurred in conjunction with further restructuring and integrating our business, consisting of $42 million
of pre-tax charges principally associated with workforce reductions, with the remainder principally professional fees.
Results for 2011 also include $16.9 million of pre-tax transaction costs, primarily related to professional fees, associated
with the acquisitions of Athena and Celera (see Note 5 to the Consolidated Financial Statements). In addition, operating
income includes pre-tax charges of $5.6 million, principally representing severance and other separation benefits as well as
accelerated vesting of certain equity awards in connection with the succession of our prior CEO.
(e) In addition, we estimate that the impact of severe weather during the first quarter of 2011 adversely affected operating
income for 2011 by $18.5 million.
(f) Operating income includes $26.8 million of costs principally associated with workforce reductions and $9.6 million of
costs associated with the settlement of employment litigation.
(g) In addition, we estimate that the impact of severe weather during the first quarter of 2010 adversely affected operating
income for 2010 by $14.1 million.
(h) Operating income includes a $15.5 million gain associated with an insurance settlement for storm-related losses.
(i) Operating income includes $16.2 million of costs, primarily associated with workforce reductions.