Quest Diagnostics 2012 Annual Report Download - page 103
Download and view the complete annual report
Please find page 103 of the 2012 Quest Diagnostics annual report below. You can navigate through the pages in the report by either clicking on the pages listed below, or by using the keyword search tool below to find specific information within the annual report.-
 1
1 -
2
-
3
-
4
-
5
-
6
-
7
-
8
-
9
-
10
-
11
-
12
-
13
-
14
-
15
-
16
-
17
-
18
-
19
-
20
-
21
-
22
-
23
-
24
-
25
-
26
-
27
-
28
-
29
-
30
-
31
-
32
-
33
-
34
-
35
-
36
-
37
-
38
-
39
-
40
-
41
-
42
-
43
-
44
-
45
-
46
-
47
-
48
-
49
-
50
-
51
-
52
-
53
-
54
-
55
-
56
-
57
-
58
-
59
-
60
-
61
-
62
-
63
-
64
-
65
-
66
-
67
-
68
-
69
-
70
-
71
-
72
-
73
-
74
-
75
-
76
-
77
-
78
-
79
-
80
-
81
-
82
-
83
-
84
-
85
-
86
-
87
-
88
-
89
-
90
-
91
-
92
-
 93
93 -
 94
94 -
 95
95 -
 96
96 -
 97
97 -
 98
98 -
 99
99 -
 100
100 -
 101
101 -
 102
102 -
 103
103 -
 104
104 -
 105
105 -
 106
106 -
 107
107 -
 108
108 -
 109
109 -
 110
110 -
 111
111 -
 112
112 -
 113
113 -
114
-
115
-
116
-
117
-
118
-
119
-
120
-
121
-
122
-
123
-
124
-
125
-
126
 |
 |

F- 30
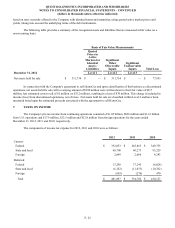
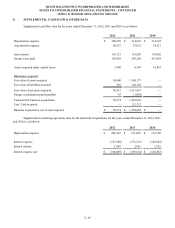
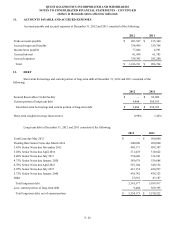
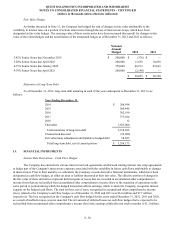
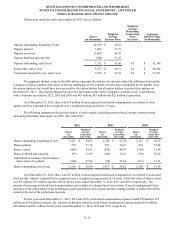
Fair Value Hedges
As further discussed in Note 13, the Company has hedged the risk of changes in fair value attributable to the
variability in interest rates on a portion of certain senior notes through the use of interest rate swaps, which have been
designated as fair value hedges. The carrying value of these senior notes have been increased (decreased) for changes in fair
value of the related hedges and the amortization of the terminated hedges as of December 31, 2012 and 2011 as follows:
Notional
Amount
Hedged 2012 2011
5.45% Senior Notes due November 2015 $ 200,000 $ (376)$ —
3.20% Senior Notes due April 2016 200,000 11,659 10,858
4.75% Senior Notes due January 2020 350,000 48,912 45,662
4.70% Senior Notes due April 2021 200,000 (2,140)—
$ 58,055 $ 56,520
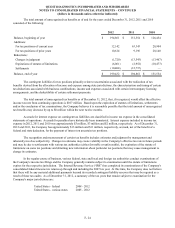
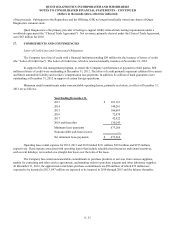
Maturities of Long-Term Debt
As of December 31, 2012, long-term debt maturing in each of the years subsequent to December 31, 2013 is as
follows:
Year Ending December 31,
2014 $ 208,994
2015 506,446
2016 302,190
2017 375,564
2018 12
Thereafter 1,925,000
Total maturities of long-term debt 3,318,206
Unamortized discount (22,088)
Fair value basis adjustments attributable to hedged debt 58,055
Total long-term debt, net of current portion $ 3,354,173
13. FINANCIAL INSTRUMENTS
Interest Rate Derivatives – Cash Flow Hedges
The Company has entered into various interest rate lock agreements and forward starting interest rate swap agreements
to hedge part of the Company's interest rate exposure associated with the variability in future cash flows attributable to changes
in interest rates. Prior to their maturity or settlement, the Company records derivative financial instruments, which have been
designated as cash flow hedges, as either an asset or liability measured at their fair value. The effective portion of changes in
the fair value of these derivatives represent deferred gains or losses that are recorded in accumulated other comprehensive
income (loss) that are reclassified from accumulated other comprehensive income (loss) to the statement of operations in the
same period or periods during which the hedged transaction affects earnings, which is when the Company recognizes interest
expense on the hedged cash flows. The total net loss, net of taxes, recognized in accumulated other comprehensive income
(loss), related to the Company's cash flow hedges as of December 31, 2012 and 2011 was $6.8 million and $7.7 million,
respectively. The loss recognized on the Company's cash flow hedges for the years ended December 31, 2012, 2011 and 2010,
as a result of ineffectiveness, was not material. The net amount of deferred losses on cash flow hedges that is expected to be
reclassified from accumulated other comprehensive income (loss) into earnings within the next twelve months is $1.3 million.
QUEST DIAGNOSTICS INCORPORATED AND SUBSIDIARIES
NOTES TO CONSOLIDATED FINANCIAL STATEMENTS – CONTINUED
(dollars in thousands unless otherwise indicated)