Quest Diagnostics 2012 Annual Report Download - page 68
Download and view the complete annual report
Please find page 68 of the 2012 Quest Diagnostics annual report below. You can navigate through the pages in the report by either clicking on the pages listed below, or by using the keyword search tool below to find specific information within the annual report.-
 1
1 -
2
-
3
-
4
-
5
-
6
-
7
-
8
-
9
-
10
-
11
-
12
-
13
-
14
-
15
-
16
-
17
-
18
-
19
-
20
-
21
-
22
-
23
-
24
-
25
-
26
-
27
-
28
-
29
-
30
-
31
-
32
-
33
-
34
-
35
-
36
-
37
-
38
-
39
-
40
-
41
-
42
-
43
-
44
-
45
-
46
-
47
-
48
-
49
-
50
-
51
-
52
-
53
-
54
-
55
-
56
-
57
-
 58
58 -
 59
59 -
 60
60 -
 61
61 -
 62
62 -
 63
63 -
 64
64 -
 65
65 -
 66
66 -
 67
67 -
 68
68 -
 69
69 -
 70
70 -
 71
71 -
 72
72 -
 73
73 -
 74
74 -
 75
75 -
 76
76 -
 77
77 -
 78
78 -
79
-
80
-
81
-
82
-
83
-
84
-
85
-
86
-
87
-
88
-
89
-
90
-
91
-
92
-
93
-
94
-
95
-
96
-
97
-
98
-
99
-
100
-
101
-
102
-
103
-
104
-
105
-
106
-
107
-
108
-
109
-
110
-
111
-
112
-
113
-
114
-
115
-
116
-
117
-
118
-
119
-
120
-
121
-
122
-
123
-
124
-
125
-
126
 |
 |
65
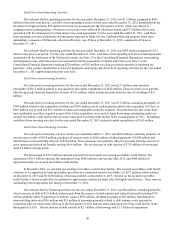
In prior years, we entered into various fixed-to-variable interest rate swap agreements with an aggregate notional
amount of $550 million and variable interest rates based on six-month LIBOR plus 0.54% and one-month LIBOR plus 1.33%.
In July 2012, we monetized the value of these interest rate swap assets by terminating the hedging instruments. The asset
value, including accrued interest through the date of termination, was $71.8 million and the amount to be amortized as a
reduction of interest expense over the remaining terms of the hedged debt instruments was $65.2 million. Immediately after the
termination of these interest rate swaps, we entered into new fixed-to-variable interest rate swap agreements on the same Senior
Notes. The interest rate swap agreements we entered into in July 2012 have an aggregate notional amount of $550 million and
variable interest rates based on six-month LIBOR plus 2.3% and one-month LIBOR plus 3.6% and are accounted for as fair
value hedges of a portion of the Senior Notes due 2016 and a portion of the Senior Notes due 2020. During the fourth quarter
of 2012, we entered into additional fixed-to-variable interest rate swap agreements with an aggregate notional amount of $400
million and variable interest rates based on one-month LIBOR plus a spread ranging from 3.4% and 5.1%. These derivative
financial instruments are accounted for as fair value hedges of a portion of the Senior Notes due 2015 and a portion of the
Senior Notes due 2021. Based on our net exposure to interest rate changes, a hypothetical 10% change in interest rates on our
variable rate indebtedness (representing 5 basis points) would impact annual interest expense by approximately $0.6 million,
assuming no changes to the debt outstanding at December 31, 2012.
The fair value of the fixed-to-variable interest rate swap agreements related to our Senior Notes due 2016 was an asset
of $0.8 million at December 31, 2012. A hypothetical 10% change in interest rates (representing 5 basis points) would
potentially change the fair value of the asset by $0.5 million. The aggregate fair value of the fixed-to-variable interest rate swap
agreements related to our Senior Notes due 2015, 2020 and 2021 was a liability of $3.1 million at December 31, 2012. A
hypothetical 10% change in interest rates (representing 10 basis points) would potentially change the fair value of this liability
by $5.2 million.
For further details regarding our outstanding debt and our financial instruments, see Notes 12 and 13 to the
Consolidated Financial Statements.
Risk Associated with Investment Portfolio
Our investment portfolio includes equity investments comprised primarily of strategic equity holdings in privately
held companies. These securities are exposed to price fluctuations and are generally concentrated in the life sciences industry.
The carrying value of our equity investments was $12.2 million at December 31, 2012.
We regularly evaluate the fair value measurements of our equity investments to determine if losses in value are other
than temporary and if an impairment loss has been incurred. The evaluation considers whether the security has the ability to
recover and, if so, the estimated recovery period. Other factors that are considered in this evaluation include the amount of the
other-than-temporary decline and its duration, the issuer’s financial condition and short-term prospects, and whether the market
decline was caused by overall economic conditions or conditions specific to the individual security.
We do not hedge our equity price risk. The impact of an adverse movement in equity prices on our holdings in
privately held companies cannot be easily quantified, as our ability to realize returns on investments depends on, among other
things, the enterprises’ ability to raise additional capital or derive cash inflows from continuing operations or through liquidity
events such as initial public offerings, mergers or private sales.
Liquidity and Capital Resources
Cash and Cash Equivalents
Cash and cash equivalents at December 31, 2012 totaled $296 million, compared to $165 million at December 31,
2011. Cash and cash equivalents consist of cash and highly liquid short-term investments. For the year ended December 31,
2012, cash flows from operating activities of $1.2 billion were used to fund investing and financing activities of $217 million
and $822 million, respectively. Cash and cash equivalents at December 31, 2011 totaled $165 million compared to $449 million
at December 31, 2010. For the year ended December 31, 2011, cash flows from operating activities of $895 million, together
with cash on hand and cash flows from financing activities of $64 million, were used to fund investing activities of $1.2 billion.