Quest Diagnostics 2012 Annual Report Download - page 50
Download and view the complete annual report
Please find page 50 of the 2012 Quest Diagnostics annual report below. You can navigate through the pages in the report by either clicking on the pages listed below, or by using the keyword search tool below to find specific information within the annual report.-
 1
1 -
2
-
3
-
4
-
5
-
6
-
7
-
8
-
9
-
10
-
11
-
12
-
13
-
14
-
15
-
16
-
17
-
18
-
19
-
20
-
21
-
22
-
23
-
24
-
25
-
26
-
27
-
28
-
29
-
30
-
31
-
32
-
33
-
34
-
35
-
36
-
37
-
38
-
39
-
 40
40 -
 41
41 -
 42
42 -
 43
43 -
 44
44 -
 45
45 -
 46
46 -
 47
47 -
 48
48 -
 49
49 -
 50
50 -
 51
51 -
 52
52 -
 53
53 -
 54
54 -
 55
55 -
 56
56 -
 57
57 -
 58
58 -
 59
59 -
 60
60 -
61
-
62
-
63
-
64
-
65
-
66
-
67
-
68
-
69
-
70
-
71
-
72
-
73
-
74
-
75
-
76
-
77
-
78
-
79
-
80
-
81
-
82
-
83
-
84
-
85
-
86
-
87
-
88
-
89
-
90
-
91
-
92
-
93
-
94
-
95
-
96
-
97
-
98
-
99
-
100
-
101
-
102
-
103
-
104
-
105
-
106
-
107
-
108
-
109
-
110
-
111
-
112
-
113
-
114
-
115
-
116
-
117
-
118
-
119
-
120
-
121
-
122
-
123
-
124
-
125
-
126
 |
 |
47
Dividends
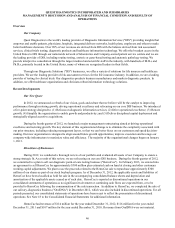
In connection with our strategy of delivering disciplined capital deployment, we announced that our Board of
Directors increased our quarterly dividend to $0.30 per common share from $0.17 per common share, commencing with the
dividend payable on January 28, 2013 to holders of record of our common stock on January 11, 2013. This 76% increase raises
the annual dividend rate to $1.20 per common share from $0.68 per common share and represents a three-fold increase from
the annual rate in effect in 2011.
Initiatives to Improve Operating Efficiency and Restore Growth
The diagnostic testing industry is labor intensive. Employee compensation and benefits constitute approximately one-
half of our total costs and expenses. Cost of services consists principally of costs for obtaining, transporting and testing
specimens. Selling, general and administrative expenses consist principally of the costs associated with our sales and marketing
efforts, billing operations, bad debt expense and general management and administrative support. In addition, performing
diagnostic testing involves significant fixed costs for facilities and other infrastructure required to obtain, transport and test
specimens. Therefore, relatively small changes in volume can have a significant impact on profitability in the short-term.
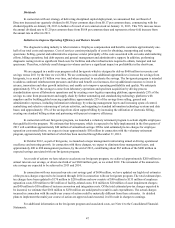
We are engaged in a multi-year program called Invigorate which is designed to deliver $600 million in run-rate cost
savings versus 2011 by the time we exit 2014. We are continuing to seek additional opportunities to increase the savings from
Invigorate, to as much as $1 billion over time, and where practical to accelerate the savings. The Invigorate program is intended
to address continued reimbursement pressures and labor and benefit cost increases, free up additional resources to invest in
science, innovation and other growth initiatives, and enable us to improve operating profitability and quality. We anticipate
approximately 35% of the savings to come from laboratory operations and specimen acquisition by driving process
standardization across all laboratory operations and by creating a new logistics operating platform; approximately 25% of the
savings to come from procurement and supply chain by further automating and standardizing technology platforms with
suppliers and by building global sourcing capabilities; approximately 25% of the savings from selling, general and
administrative expenses, including information technology, by reducing management layers and increasing spans of control,
centralizing and selective outsourcing of certain activities, and migrating to standard information technology systems and data
bases; and approximately 15% of the savings from client support/billing by increasing the utilization of electronic billing,
creating one standard billing system and partnering with payers to improve efficiency.
In connection with our Invigorate program, we launched a voluntary retirement program to certain eligible employees
that qualified for the program. We estimate that this program, which is expected to be fully implemented in the first quarter of
2013 will contribute approximately $40 million of annualized savings. Of the total estimated pre-tax charges for employee
separation costs noted below, we expect to incur approximately $50 million in connection with the voluntary retirement
program, approximately $44 million of which has been incurred through December 31, 2012.
In October 2012, as part of Invigorate, we launched a major management restructuring aimed at driving operational
excellence and restoring growth. In connection with these changes, we expect to eliminate three management layers, and
approximately 400 to 600 management positions, by the end of 2013, contributing about $65 million of the $600 million in
expected savings associated with our Invigorate program.
As a result of actions we have taken to accelerate our Invigorate program, we achieved approximately $200 million in
annual run-rate cost savings, or about one-third of our $600 million goal, as we exited 2012. The remainder of the annual run-
rate savings are expected to be achieved in 2013 and 2014.
In connection with our increased run-rate cost savings goal of $600 million, we have updated our high-level estimates
of the pre-tax charges expected to be incurred through 2014 in connection with our Invigorate program. The total estimated pre-
tax charges have been updated to $170 million to $250 million and now consists of $90 million to $135 million of employee
separation costs; $30 million to $45 million of facility-related costs; $10 million to $20 million of asset impairment charges;
and $40 million to $50 million of systems conversion and integration costs. Of the total estimated pre-tax charges expected to
be incurred, we estimate that $160 million to $230 million are anticipated to result in cash expenditures. The actual charges
incurred in connection with the multi-year course of action could be materially different from these estimates. As detailed
plans to implement the multi-year course of action are approved and executed, it will result in charges to earnings.
For additional information on the Invigorate program and associated costs, see Note 4 to the Consolidated Financial
Statements.