Quest Diagnostics 2012 Annual Report Download - page 62
Download and view the complete annual report
Please find page 62 of the 2012 Quest Diagnostics annual report below. You can navigate through the pages in the report by either clicking on the pages listed below, or by using the keyword search tool below to find specific information within the annual report.-
 1
1 -
2
-
3
-
4
-
5
-
6
-
7
-
8
-
9
-
10
-
11
-
12
-
13
-
14
-
15
-
16
-
17
-
18
-
19
-
20
-
21
-
22
-
23
-
24
-
25
-
26
-
27
-
28
-
29
-
30
-
31
-
32
-
33
-
34
-
35
-
36
-
37
-
38
-
39
-
40
-
41
-
42
-
43
-
44
-
45
-
46
-
47
-
48
-
49
-
50
-
51
-
 52
52 -
 53
53 -
 54
54 -
 55
55 -
 56
56 -
 57
57 -
 58
58 -
 59
59 -
 60
60 -
 61
61 -
 62
62 -
 63
63 -
 64
64 -
 65
65 -
 66
66 -
 67
67 -
 68
68 -
 69
69 -
 70
70 -
 71
71 -
 72
72 -
73
-
74
-
75
-
76
-
77
-
78
-
79
-
80
-
81
-
82
-
83
-
84
-
85
-
86
-
87
-
88
-
89
-
90
-
91
-
92
-
93
-
94
-
95
-
96
-
97
-
98
-
99
-
100
-
101
-
102
-
103
-
104
-
105
-
106
-
107
-
108
-
109
-
110
-
111
-
112
-
113
-
114
-
115
-
116
-
117
-
118
-
119
-
120
-
121
-
122
-
123
-
124
-
125
-
126
 |
 |

59
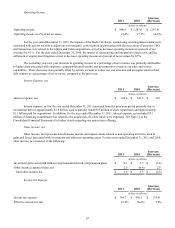
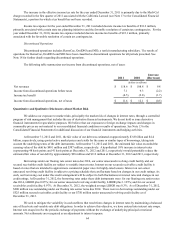
Interest Expense, net
Increase
(Decrease)2012 2011
(dollars in millions)
Interest expense, net $ 164.7 $ 169.6 $ (4.9)
Interest expense, net for the year ended December 31, 2012 decreased, compared to prior year period, primarily due to
lower average outstanding debt balances in 2012 and the financing commitment fees incurred in 2011 related to the acquisition
of Celera.
Other Income, net
Other income, net represents miscellaneous income and expense items related to non-operating activities, such as
gains and losses associated with investments and other non-operating assets. For the years ended December 31, 2012 and 2011,
other income, net consisted of the following:
Increase
(Decrease)2012 2011
(dollars in millions)
Investment gains associated with our supplemental deferred compensation plans $ 6.5 $ 0.3 $ 6.2
Other income items, net 0.2 2.5 (2.3)
Total other income, net $ 6.7 $ 2.8 $ 3.9
Income Tax Expense
Increase
(Decrease)
2012 2011
(dollars in millions)
Income tax expense $ 401.9 $ 354.7 $ 47.2
Effective income tax rate 37.6% 41.8% (4.2)%
The decrease in the effective income tax rate for the year ended December 31, 2012, compared to the prior year
period, is due primarily to the Medi-Cal charge in 2011, a portion for which a tax benefit was not recorded.
Income tax expense for the years ended December 31, 2012 and 2011 included discrete income tax benefits of $2.9
million and $18.2 million, respectively. Discrete income tax benefits for 2011 were primarily associated with certain state tax
planning initiatives and the favorable resolution of certain tax contingencies.
Discontinued Operations
Discontinued operations includes HemoCue, OralDNA and NID, a test kit manufacturing subsidiary. The results of
operations for HemoCue, OralDNA and NID have been classified as discontinued operations for all periods presented. See
Note 18 for further details regarding discontinued operations.