Quest Diagnostics 2012 Annual Report Download - page 46
Download and view the complete annual report
Please find page 46 of the 2012 Quest Diagnostics annual report below. You can navigate through the pages in the report by either clicking on the pages listed below, or by using the keyword search tool below to find specific information within the annual report.-
 1
1 -
2
-
3
-
4
-
5
-
6
-
7
-
8
-
9
-
10
-
11
-
12
-
13
-
14
-
15
-
16
-
17
-
18
-
19
-
20
-
21
-
22
-
23
-
24
-
25
-
26
-
27
-
28
-
29
-
30
-
31
-
32
-
33
-
34
-
35
-
 36
36 -
 37
37 -
 38
38 -
 39
39 -
 40
40 -
 41
41 -
 42
42 -
 43
43 -
 44
44 -
 45
45 -
 46
46 -
 47
47 -
 48
48 -
 49
49 -
 50
50 -
 51
51 -
 52
52 -
 53
53 -
 54
54 -
 55
55 -
 56
56 -
57
-
58
-
59
-
60
-
61
-
62
-
63
-
64
-
65
-
66
-
67
-
68
-
69
-
70
-
71
-
72
-
73
-
74
-
75
-
76
-
77
-
78
-
79
-
80
-
81
-
82
-
83
-
84
-
85
-
86
-
87
-
88
-
89
-
90
-
91
-
92
-
93
-
94
-
95
-
96
-
97
-
98
-
99
-
100
-
101
-
102
-
103
-
104
-
105
-
106
-
107
-
108
-
109
-
110
-
111
-
112
-
113
-
114
-
115
-
116
-
117
-
118
-
119
-
120
-
121
-
122
-
123
-
124
-
125
-
126
 |
 |

43
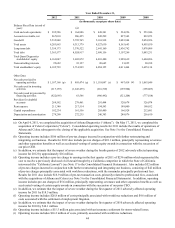
Year Ended December 31,
2012 2011 2010 2009 2008
(in thousands, except per share data)
Operations Data: (a)
Net revenues $ 7,382,562 $ 7,391,932 $ 7,260,120 $ 7,359,875 $ 7,153,598
Operating income 1,200,797 (b)(c) 986,641 (d)(e) 1,283,583 (f)(g) 1,344,253 (h) 1,210,323 (i)
Income from continuing
operations 666,498 494,092 (j) 744,857 (k) 748,169 (l) 645,379 (m)
Income (loss) from discontinued
operations, net of taxes (74,364) (n) 11,558 12,160 18,053 (32,184) (o)
Net income 592,134 505,650 757,017 766,222 613,195
Less: Net income attributable to
noncontrolling interests 36,413 35,083 36,123 37,111 31,705
Net income attributable to Quest
Diagnostics 555,721 470,567 720,894 729,111 581,490
Amounts attributable to Quest
Diagnostics' stockholders:
Income from continuing
operations 630,085 459,009 708,734 711,058 613,674
Income (loss) from discontinued
operations, net of taxes (74,364) 11,558 12,160 18,053 (32,184)
Net income 555,721 470,567 720,894 729,111 581,490
Earnings per share attributable
to Quest Diagnostics'
common stockholders - basic:
Income from continuing
operations $ 3.96 $ 2.88 $ 4.01 $ 3.81 $ 3.15
Income (loss) from discontinued
operations (0.47) 0.07 0.07 0.10 (0.16)
Net income $ 3.49 $ 2.95 $ 4.08 $ 3.91 $ 2.99
Earnings per share attributable
to Quest Diagnostics'
common stockholders -
diluted:
Income from continuing
operations $ 3.92 $ 2.85 $ 3.98 $ 3.77 $ 3.13
Income (loss) from discontinued
operations (0.46) 0.07 0.07 0.10 (0.17)
Net income $ 3.46 $ 2.92 $ 4.05 $ 3.87 $ 2.96
Dividends per common share $ 0.81 $ 0.47 $ 0.40 $ 0.40 $ 0.40