Quest Diagnostics 2012 Annual Report Download - page 59
Download and view the complete annual report
Please find page 59 of the 2012 Quest Diagnostics annual report below. You can navigate through the pages in the report by either clicking on the pages listed below, or by using the keyword search tool below to find specific information within the annual report.-
 1
1 -
2
-
3
-
4
-
5
-
6
-
7
-
8
-
9
-
10
-
11
-
12
-
13
-
14
-
15
-
16
-
17
-
18
-
19
-
20
-
21
-
22
-
23
-
24
-
25
-
26
-
27
-
28
-
29
-
30
-
31
-
32
-
33
-
34
-
35
-
36
-
37
-
38
-
39
-
40
-
41
-
42
-
43
-
44
-
45
-
46
-
47
-
48
-
 49
49 -
 50
50 -
 51
51 -
 52
52 -
 53
53 -
 54
54 -
 55
55 -
 56
56 -
 57
57 -
 58
58 -
 59
59 -
 60
60 -
 61
61 -
 62
62 -
 63
63 -
 64
64 -
 65
65 -
 66
66 -
 67
67 -
 68
68 -
 69
69 -
70
-
71
-
72
-
73
-
74
-
75
-
76
-
77
-
78
-
79
-
80
-
81
-
82
-
83
-
84
-
85
-
86
-
87
-
88
-
89
-
90
-
91
-
92
-
93
-
94
-
95
-
96
-
97
-
98
-
99
-
100
-
101
-
102
-
103
-
104
-
105
-
106
-
107
-
108
-
109
-
110
-
111
-
112
-
113
-
114
-
115
-
116
-
117
-
118
-
119
-
120
-
121
-
122
-
123
-
124
-
125
-
126
 |
 |

56
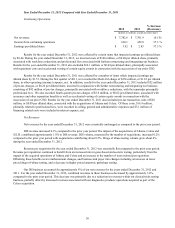
Year Ended December 31, 2012 Compared with Year Ended December 31, 2011
Continuing Operations
% Increase
(Decrease)2012 2011
(dollars in millions, except per share data)
Net revenues $ 7,382.6 $ 7,391.9 (0.1)%
Income from continuing operations 630.1 459.0 37.3 %
Earnings per diluted share $ 3.92 $ 2.85 37.5 %
Results for the year ended December 31, 2012 were affected by certain items that impacted earnings per diluted share
by $0.44. During the year ended December 31, 2012, we incurred costs of $106 million, or $0.40 per diluted share, primarily
associated with workforce reductions and professional fees associated with further restructuring and integrating our business.
Results for the year ended December 31, 2012 also included $10.1 million, or $0.04 per diluted share, principally associated
with separation costs and accelerated vesting of certain equity awards in connection with the succession of our prior CEO.
Results for the year ended December 31, 2011 were affected by a number of items which impacted earnings per
diluted share by $1.53. During the first quarter of 2011, we recorded the Medi-Cal charge of $236 million, or $1.22 per diluted
share, in other operating (income) expense, net. In addition, results for the year ended December 31, 2011 included $52 million
of pre-tax charges, or $0.20 per diluted share, incurred in conjunction with further restructuring and integrating our business
consisting of $42 million of pre-tax charges, principally associated with workforce reductions, with the remainder principally
professional fees. We also recorded fourth quarter pre-tax charges of $5.6 million, or $0.02 per diluted share, associated with
severance and other separation benefits as well as accelerated vesting of certain equity awards in connection with the
succession of our prior CEO. Results for the year ended December 31, 2011 also included pre-tax transaction costs of $20
million, or $0.09 per diluted share, associated with the acquisitions of Athena and Celera. Of these costs, $16.9 million,
primarily related to professional fees, were recorded in selling, general and administrative expenses and $3.1 million of
financing related costs were included in interest expense, net.
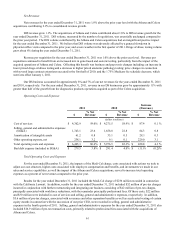
Net Revenues
Net revenues for the year ended December 31, 2012 were essentially unchanged as compared to the prior year period.
DIS revenue increased 0.1% compared to the prior year period. The impact of the acquisitions of Athena, Celera and
S.E.D. contributed approximately 1.0% to DIS revenue. DIS volume, measured by the number of requisitions, increased 0.2%
compared to the prior year period with acquisitions contributing about 0.5%. Drugs of abuse testing volume grew about 6%
during the year ended December 31, 2012.
Revenue per requisition for the year ended December 31, 2012 was essentially flat compared to the prior year period.
Revenue per requisition continued to benefit from an increased mix in gene-based and esoteric testing, particularly from the
impact of the acquired operations of Athena and Celera and an increase in the number of tests ordered per requisition.
Offsetting these benefits were reimbursement changes, and business and payer mix changes including an increase in lower
priced drugs-of-abuse testing, and a decrease in higher priced anatomic pathology testing.
Our DS business accounted for approximately 8% of our net revenues for the years ended December 31, 2012 and
2011. For the year ended December 31, 2012, combined revenues in these businesses decreased by approximately 3.0%,
compared to the prior year period. This decrease was primarily due to a reduction in revenues within our clinical trials testing
business, partially offset by increased revenues associated with our diagnostics products operations acquired as part of the
Celera acquisition.