Pottery Barn 2011 Annual Report Download - page 75
Download and view the complete annual report
Please find page 75 of the 2011 Pottery Barn annual report below. You can navigate through the pages in the report by either clicking on the pages listed below, or by using the keyword search tool below to find specific information within the annual report.-
 1
1 -
2
-
3
-
4
-
5
-
6
-
7
-
8
-
9
-
10
-
11
-
12
-
13
-
14
-
15
-
16
-
17
-
18
-
19
-
20
-
21
-
22
-
23
-
24
-
25
-
26
-
27
-
28
-
29
-
30
-
31
-
32
-
33
-
34
-
35
-
36
-
37
-
38
-
39
-
40
-
41
-
42
-
43
-
44
-
45
-
46
-
47
-
48
-
49
-
50
-
51
-
52
-
53
-
54
-
55
-
56
-
57
-
58
-
59
-
60
-
61
-
62
-
63
-
64
-
 65
65 -
 66
66 -
 67
67 -
 68
68 -
 69
69 -
 70
70 -
 71
71 -
 72
72 -
 73
73 -
 74
74 -
 75
75 -
 76
76 -
 77
77 -
 78
78 -
 79
79 -
 80
80 -
 81
81 -
 82
82 -
 83
83 -
 84
84 -
 85
85 -
86
-
87
-
88
-
89
-
90
-
91
-
92
-
93
-
94
-
95
-
96
-
97
-
98
-
99
-
100
-
101
-
102
-
103
-
104
-
105
-
106
-
107
-
108
-
109
-
110
-
111
-
112
-
113
-
114
-
115
-
116
-
117
-
118
-
119
-
120
-
121
-
122
-
123
-
124
-
125
-
126
-
127
-
128
-
129
-
130
-
131
-
132
-
133
-
134
-
135
-
136
-
137
-
138
-
139
-
140
-
141
-
142
-
143
-
144
-
145
-
146
-
147
-
148
-
149
-
150
-
151
-
152
-
153
-
154
-
155
-
156
-
157
-
158
-
159
-
160
-
161
-
162
-
163
-
164
-
165
-
166
-
167
-
168
-
169
-
170
-
171
-
172
-
173
-
174
-
175
-
176
-
177
-
178
-
179
-
180
-
181
-
182
-
183
-
184
 |
 |

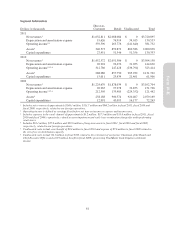
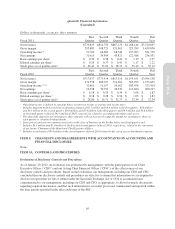
Segment Information
Dollars in thousands
Direct-to-
Customer Retail Unallocated Total
2011
Net revenues1$1,632,811 $2,088,084 $ 0 $3,720,895
Depreciation and amortization expense 19,626 76,914 34,013 130,553
Operating income2,3 359,596 263,776 (241,640) 381,732
Assets4340,573 859,879 860,386 2,060,838
Capital expenditures 27,451 51,546 51,356 130,353
2010
Net revenues1$1,452,572 $2,051,586 $ 0 $3,504,158
Depreciation and amortization expense 20,901 92,676 31,053 144,630
Operating income2,3,5,6 312,780 247,428 (236,794) 323,414
Assets4288,080 857,750 985,932 2,131,762
Capital expenditures 15,011 25,434 21,461 61,906
2009
Net revenues1$1,224,670 $1,878,034 $ 0 $3,102,704
Depreciation and amortization expense 20,965 97,978 32,853 151,796
Operating income2,3,5,6 212,305 133,489 (224,352) 121,442
Assets4258,188 900,574 920,407 2,079,169
Capital expenditures 12,991 43,095 16,177 72,263
1Includes net revenues of approximately $140.1 million, $113.7 million and $84.2 million in fiscal 2011, fiscal 2010 and
fiscal 2009, respectively, related to our foreign operations.
2Operating income is defined as earnings (loss) before net interest income or expense and income taxes.
3Includes expenses in the retail channel of approximately $3.2 million, $17.5 million and $35.0 million in fiscal 2011, fiscal
2010 and fiscal 2009, respectively, related to asset impairment and early lease termination charges for underperforming
retail stores.
4Includes $24.1 million, $27.0 million and $29.6 million of long-term assets in fiscal 2011, fiscal 2010 and fiscal 2009,
respectively, related to our foreign operations.
5Unallocated costs include a net benefit of $0.4 million in fiscal 2010 and expense of $7.6 million in fiscal 2009 related to
the exit of excess distribution capacity.
6Unallocated costs include $4.3 million in fiscal 2010 related to the retirement of our former Chairman of the Board and
Chief Executive Officer and a $1.9 million benefit in fiscal 2009 representing Visa/MasterCard litigation settlement
income.
61
Form 10-K