Pottery Barn 2011 Annual Report Download - page 46
Download and view the complete annual report
Please find page 46 of the 2011 Pottery Barn annual report below. You can navigate through the pages in the report by either clicking on the pages listed below, or by using the keyword search tool below to find specific information within the annual report.-
 1
1 -
2
-
3
-
4
-
5
-
6
-
7
-
8
-
9
-
10
-
11
-
12
-
13
-
14
-
15
-
16
-
17
-
18
-
19
-
20
-
21
-
22
-
23
-
24
-
25
-
26
-
27
-
28
-
29
-
30
-
31
-
32
-
33
-
34
-
35
-
 36
36 -
 37
37 -
 38
38 -
 39
39 -
 40
40 -
 41
41 -
 42
42 -
 43
43 -
 44
44 -
 45
45 -
 46
46 -
 47
47 -
 48
48 -
 49
49 -
 50
50 -
 51
51 -
 52
52 -
 53
53 -
 54
54 -
 55
55 -
 56
56 -
57
-
58
-
59
-
60
-
61
-
62
-
63
-
64
-
65
-
66
-
67
-
68
-
69
-
70
-
71
-
72
-
73
-
74
-
75
-
76
-
77
-
78
-
79
-
80
-
81
-
82
-
83
-
84
-
85
-
86
-
87
-
88
-
89
-
90
-
91
-
92
-
93
-
94
-
95
-
96
-
97
-
98
-
99
-
100
-
101
-
102
-
103
-
104
-
105
-
106
-
107
-
108
-
109
-
110
-
111
-
112
-
113
-
114
-
115
-
116
-
117
-
118
-
119
-
120
-
121
-
122
-
123
-
124
-
125
-
126
-
127
-
128
-
129
-
130
-
131
-
132
-
133
-
134
-
135
-
136
-
137
-
138
-
139
-
140
-
141
-
142
-
143
-
144
-
145
-
146
-
147
-
148
-
149
-
150
-
151
-
152
-
153
-
154
-
155
-
156
-
157
-
158
-
159
-
160
-
161
-
162
-
163
-
164
-
165
-
166
-
167
-
168
-
169
-
170
-
171
-
172
-
173
-
174
-
175
-
176
-
177
-
178
-
179
-
180
-
181
-
182
-
183
-
184
 |
 |
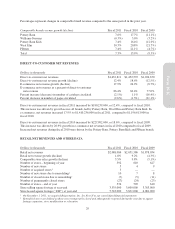
charges for underperforming retail stores, selling, general and administrative expenses as a percentage of net
revenues decreased to 29.0% in fiscal 2011 from 30.0% in fiscal 2010 (which included $16,384,000 from asset
impairment and early lease termination charges for underperforming retail stores and $4,319,000 associated with
the retirement of our former Chairman and Chief Executive Officer). This decrease was primarily driven by a
decrease in asset impairment and early lease termination charges related to our underperforming retail stores in
fiscal 2011, lower incentive compensation costs, greater advertising productivity and reductions in other general
expenses. This decrease was partially offset by higher employment which is reflective of our planned incremental
investment to support our e-commerce, global expansion and business development growth strategies.
In the direct-to-customer channel, selling, general and administrative expenses as a percentage of
direct-to-customer net revenues decreased approximately 120 basis points in fiscal 2011 compared to fiscal 2010.
This decrease as a percentage of net revenues was primarily driven by greater advertising productivity and the
leverage of other general expenses due to increasing net revenues, partially offset by higher employment.
In the retail channel, selling, general and administrative expenses as a percentage of retail net revenues decreased
approximately 60 basis points in fiscal 2011 compared to fiscal 2010. This decrease as a percentage of net
revenues was primarily driven by a decrease in asset impairment and early lease termination charges and
reductions in other general expenses, partially offset by higher employment.
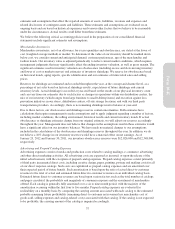
Fiscal 2010 vs. Fiscal 2009
Selling, general and administrative expenses increased by $68,650,000, or 7.0%, in fiscal 2010 compared to
fiscal 2009. Including expense of approximately $16,384,000 from asset impairment and early lease termination
charges for underperforming retail stores and $4,319,000 associated with the retirement of our former Chairman
and Chief Executive Officer, selling, general and administrative expenses as a percentage of net revenues
decreased to 30.0% in fiscal 2010 from 31.6% in fiscal 2009 (which included $32,898,000 from asset impairment
and early lease termination charges for underperforming retail stores and $5,981,000 associated with the exit of
excess distribution capacity). This decrease was primarily driven by lower employment costs (including the rate
benefit from a higher proportion of total company net revenues being generated year-over-year in the
direct-to-customer channel, which incurs a lower rate of employment expenses than the retail channel), a
decrease in asset impairment and lease termination charges related to our underperforming retail stores in fiscal
2010, a decrease in other general expenses, expense related to the exit of excess distribution capacity recorded in
fiscal 2009 that did not recur in fiscal 2010, and a reduction in the total company advertising expense rate despite
the impact from a higher proportion of total company net revenues being generated year-over-year in the
direct-to-customer channel. This decrease was partially offset by expense associated with the retirement of our
former Chairman and Chief Executive Officer in fiscal 2010.
In the direct-to-customer channel, selling, general and administrative expenses as a percentage of
direct-to-customer net revenues decreased approximately 190 basis points in fiscal 2010 compared to fiscal 2009.
This decrease as a percentage of net revenues was primarily driven by a reduction in the advertising expense rate
and lower employment costs.
In the retail channel, selling, general and administrative expenses as a percentage of retail net revenues decreased
approximately 150 basis points in fiscal 2010 compared to fiscal 2009. This decrease as a percentage of net
revenues was primarily driven by a decrease in asset impairment and lease termination charges related to our
underperforming retail stores in fiscal 2010 and lower employment costs.
INCOME TAXES
Our effective income tax rate was 37.9% for fiscal 2011, 38.0% for fiscal 2010 and 35.6% for fiscal 2009. The
increase in the effective income tax rate in fiscal 2010 over fiscal 2009 was primarily driven by certain favorable
income tax resolutions that had a larger impact on the fiscal 2009 tax rate due to the lower level of earnings in
fiscal 2009.
32