Pottery Barn 2011 Annual Report Download - page 39
Download and view the complete annual report
Please find page 39 of the 2011 Pottery Barn annual report below. You can navigate through the pages in the report by either clicking on the pages listed below, or by using the keyword search tool below to find specific information within the annual report.-
 1
1 -
2
-
3
-
4
-
5
-
6
-
7
-
8
-
9
-
10
-
11
-
12
-
13
-
14
-
15
-
16
-
17
-
18
-
19
-
20
-
21
-
22
-
23
-
24
-
25
-
26
-
27
-
28
-
 29
29 -
 30
30 -
 31
31 -
 32
32 -
 33
33 -
 34
34 -
 35
35 -
 36
36 -
 37
37 -
 38
38 -
 39
39 -
 40
40 -
 41
41 -
 42
42 -
 43
43 -
 44
44 -
 45
45 -
 46
46 -
 47
47 -
 48
48 -
 49
49 -
50
-
51
-
52
-
53
-
54
-
55
-
56
-
57
-
58
-
59
-
60
-
61
-
62
-
63
-
64
-
65
-
66
-
67
-
68
-
69
-
70
-
71
-
72
-
73
-
74
-
75
-
76
-
77
-
78
-
79
-
80
-
81
-
82
-
83
-
84
-
85
-
86
-
87
-
88
-
89
-
90
-
91
-
92
-
93
-
94
-
95
-
96
-
97
-
98
-
99
-
100
-
101
-
102
-
103
-
104
-
105
-
106
-
107
-
108
-
109
-
110
-
111
-
112
-
113
-
114
-
115
-
116
-
117
-
118
-
119
-
120
-
121
-
122
-
123
-
124
-
125
-
126
-
127
-
128
-
129
-
130
-
131
-
132
-
133
-
134
-
135
-
136
-
137
-
138
-
139
-
140
-
141
-
142
-
143
-
144
-
145
-
146
-
147
-
148
-
149
-
150
-
151
-
152
-
153
-
154
-
155
-
156
-
157
-
158
-
159
-
160
-
161
-
162
-
163
-
164
-
165
-
166
-
167
-
168
-
169
-
170
-
171
-
172
-
173
-
174
-
175
-
176
-
177
-
178
-
179
-
180
-
181
-
182
-
183
-
184
 |
 |

ITEM 7. MANAGEMENT’S DISCUSSION AND ANALYSIS OF FINANCIAL CONDITION AND
RESULTS OF OPERATIONS
The following discussion and analysis of our financial condition, results of operations, and liquidity and capital
resources for the 52 weeks ended January 29, 2012 (“fiscal 2011”), the 52 weeks ended January 30, 2011 (“fiscal
2010”), and the 52 weeks ended January 31, 2010 (“fiscal 2009”) should be read in conjunction with our
consolidated financial statements and notes thereto. All explanations of changes in operational results are
discussed in order of magnitude.
OVERVIEW
Fiscal 2011 Financial Results
Fiscal 2011 was a year of record earnings for Williams-Sonoma, Inc. where we saw increases in revenues and
profitability, and executed key elements of our long-term strategy to be the leading multi-channel retailer of
home furnishings and house wares in the world. Through strong execution and a superior multi-channel strategy,
we delivered record earnings and profitability in a promotional retail environment.
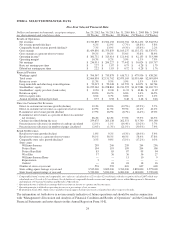
In fiscal 2011, our net revenues increased 6.2% to $3,720,895,000 compared to $3,504,158,000 in fiscal 2010
(including comparable brand revenue growth of 7.3%), and we increased our fiscal 2011 diluted earnings per
share to $2.22, versus $1.83 in fiscal 2010. We also ended the year with $502,757,000 in cash after returning
$263,306,000 to our stockholders through stock repurchases and dividends and investing approximately
$25,657,000 in the acquisition of Rejuvenation. During the year, we increased our dividend twice for a total
increase of 47%, and we announced share repurchase authorizations of $350,000,000.
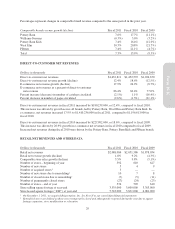
Direct-to-customer net revenues in fiscal 2011 increased by $180,239,000, or 12.4%, compared to fiscal 2010.
This increase was driven by growth across all brands, led by Pottery Barn, West Elm and Pottery Barn Kids. In
e-commerce, net revenues increased 17.9% to $1,410,236,000 in fiscal 2011, compared to $1,196,613,000 in
fiscal 2010.
Retail net revenues in fiscal 2011 increased by $36,498,000, or 1.8%, compared to fiscal 2010. This increase was
primarily driven by West Elm, Pottery Barn, international franchise operations and Pottery Barn Kids, despite a
1.5% year-over-year reduction in retail leased square footage, due to 16 net fewer stores (including the closure of
our Williams-Sonoma Home stores at the end of fiscal 2010). Comparable store sales in fiscal 2011 increased
3.5%.
In the Pottery Barn brand, comparable brand revenues increased 7.6% and net revenues grew to $1,600,847,000.
Innovative and relevant seasonal merchandise assortments and a strategic value proposition delivered these
results. In West Elm, comparable brand revenues increased 30.3%. New product and category introductions, a
strong seasonal assortment, an enhanced value proposition, and highly effective multi-channel marketing drove
these results. In the Pottery Barn Kids brand, net revenues increased to $521,565,000 and comparable brand
revenues increased 7.4%. An expanded product assortment, a compelling value proposition, and an effective
traffic-generating promotional calendar drove these results. In Williams-Sonoma, net revenues were
$994,425,000 and comparable brand revenues declined 0.3%. This net revenue decline was primarily due to
promotional activity on nationally branded products, particularly in the retail channel.
Fiscal 2011 Operational Results
Throughout the year, we continued to invest in our key long-term growth initiatives, including driving growth in
our direct-to-customer channel, expanding the reach of West Elm, increasing our global presence and executing
against our business development strategy.
In our global business, we completed the launch of our new global shipping websites across all brands (with the
exception of Rejuvenation), which allow us to ship from the U.S. to customers in more than 75 countries around
25
Form 10-K