Pottery Barn 2011 Annual Report Download - page 52
Download and view the complete annual report
Please find page 52 of the 2011 Pottery Barn annual report below. You can navigate through the pages in the report by either clicking on the pages listed below, or by using the keyword search tool below to find specific information within the annual report.-
 1
1 -
2
-
3
-
4
-
5
-
6
-
7
-
8
-
9
-
10
-
11
-
12
-
13
-
14
-
15
-
16
-
17
-
18
-
19
-
20
-
21
-
22
-
23
-
24
-
25
-
26
-
27
-
28
-
29
-
30
-
31
-
32
-
33
-
34
-
35
-
36
-
37
-
38
-
39
-
40
-
41
-
 42
42 -
 43
43 -
 44
44 -
 45
45 -
 46
46 -
 47
47 -
 48
48 -
 49
49 -
 50
50 -
 51
51 -
 52
52 -
 53
53 -
 54
54 -
 55
55 -
 56
56 -
 57
57 -
 58
58 -
 59
59 -
 60
60 -
 61
61 -
 62
62 -
63
-
64
-
65
-
66
-
67
-
68
-
69
-
70
-
71
-
72
-
73
-
74
-
75
-
76
-
77
-
78
-
79
-
80
-
81
-
82
-
83
-
84
-
85
-
86
-
87
-
88
-
89
-
90
-
91
-
92
-
93
-
94
-
95
-
96
-
97
-
98
-
99
-
100
-
101
-
102
-
103
-
104
-
105
-
106
-
107
-
108
-
109
-
110
-
111
-
112
-
113
-
114
-
115
-
116
-
117
-
118
-
119
-
120
-
121
-
122
-
123
-
124
-
125
-
126
-
127
-
128
-
129
-
130
-
131
-
132
-
133
-
134
-
135
-
136
-
137
-
138
-
139
-
140
-
141
-
142
-
143
-
144
-
145
-
146
-
147
-
148
-
149
-
150
-
151
-
152
-
153
-
154
-
155
-
156
-
157
-
158
-
159
-
160
-
161
-
162
-
163
-
164
-
165
-
166
-
167
-
168
-
169
-
170
-
171
-
172
-
173
-
174
-
175
-
176
-
177
-
178
-
179
-
180
-
181
-
182
-
183
-
184
 |
 |
Property and Equipment
Property and equipment is stated at cost. Depreciation is computed using the straight-line method over the
estimated useful lives of the assets.
We review the carrying value of all long-lived assets for impairment, primarily at a store level, whenever events
or changes in circumstances indicate that the carrying value of an asset may not be recoverable. Our impairment
analyses determine whether projected cash flows from operations are sufficient to recover the carrying value of
these assets. Impairment results when the carrying value of the asset exceeds the estimated undiscounted future
cash flows over its remaining useful life. For store impairment, our estimate of undiscounted future cash flows
over the store lease term (generally 5 to 22 years) is based upon our experience, historical operations of the stores
and estimates of future store profitability and economic conditions. The future estimates of store profitability and
economic conditions require estimating such factors as sales growth, gross margin, employment rates, lease
escalations, inflation and the overall economics of the retail industry, and are therefore subject to variability and
difficult to predict. If a long-lived asset is found to be impaired, the amount recognized for impairment is equal to
the difference between the net carrying value and the asset’s fair value. Long-lived assets are measured at fair
value on a nonrecurring basis using Level 3 inputs as defined in the fair value hierarchy. The fair value is
estimated based upon future cash flows (discounted at a rate commensurate with the risk and that approximates
our weighted average cost of capital).
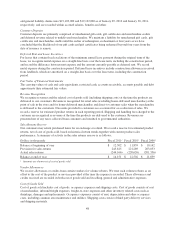
Self-Insured Liabilities
We are primarily self-insured for workers’ compensation, employee health benefits and product and general
liability claims. We record self-insurance liabilities based on claims filed, including the development of those
claims, and an estimate of claims incurred but not yet reported. Factors affecting this estimate include future
inflation rates, changes in severity, benefit level changes, medical costs and claim settlement patterns. Should a
different amount of claims occur compared to what was estimated, or costs of the claims increase or decrease
beyond what was anticipated, reserves may need to be adjusted accordingly. We determine our workers’
compensation liability and product and general liability claims reserves based on an actuarial analysis of
historical claims data. Self-insurance reserves for employee health benefits, workers’ compensation and product
and general liability claims were $19,103,000 and $19,122,000 as of January 29, 2012 and January 30, 2011,
respectively, and are recorded within accrued salaries, benefits and other within our Consolidated Balance
Sheets.
Stock-Based Compensation
We account for stock-based compensation arrangements by measuring and recording compensation expense in
our consolidated financial statements for all stock-based awards using a fair value method. For stock options and
stock-settled stock appreciation rights (“option awards”), fair value is determined using the Black-Scholes
valuation model, while restricted stock units are valued using the closing price of our stock on the date prior to
the date of grant. Significant factors affecting the fair value of option awards include the estimated future
volatility of our stock price and the estimated expected term until the option award is exercised, converted or
cancelled. The fair value of the award is amortized over the requisite service period.
Income Taxes
Income taxes are accounted for using the asset and liability method. Under this method, deferred income taxes
arise from temporary differences between the tax basis of assets and liabilities and their reported amounts in the
consolidated financial statements. We record reserves for estimates of probable settlements of foreign and
domestic tax audits. At any one time, many tax years are subject to audit by various taxing jurisdictions. The
results of these audits and negotiations with taxing authorities may affect the ultimate settlement of these issues.
Additionally, our effective tax rate in a given financial statement period may be materially impacted by changes
in the mix and level of our earnings.
38