Pizza Hut 2007 Annual Report Download - page 84
Download and view the complete annual report
Please find page 84 of the 2007 Pizza Hut annual report below. You can navigate through the pages in the report by either clicking on the pages listed below, or by using the keyword search tool below to find specific information within the annual report.-
 1
1 -
2
-
3
-
4
-
5
-
6
-
7
-
8
-
9
-
10
-
11
-
12
-
13
-
14
-
15
-
16
-
17
-
18
-
19
-
20
-
21
-
22
-
23
-
24
-
25
-
26
-
27
-
28
-
29
-
30
-
31
-
32
-
33
-
34
-
35
-
36
-
37
-
38
-
39
-
40
-
41
-
42
-
43
-
44
-
45
-
46
-
47
-
48
-
49
-
50
-
51
-
52
-
53
-
54
-
55
-
56
-
57
-
58
-
59
-
60
-
61
-
62
-
63
-
64
-
65
-
66
-
67
-
68
-
69
-
70
-
71
-
72
-
73
-
 74
74 -
 75
75 -
 76
76 -
 77
77 -
 78
78 -
 79
79 -
 80
80 -
 81
81 -
 82
82 -
 83
83 -
 84
84 -
 85
85 -
 86
86
 |
 |

88 YUM! BRANDS, INC.
Shareholder Services
DIRECT STOCK PURCHASE PLAN A prospectus and a brochure
explaining this convenient plan are available from our trans-
fer agent:
American Stock Transfer & Trust Company
P.O. Box 922
Wall Street Station
New York, NY 10269-0560
Attn: DRIP Dept.
Phone: (888)439-4986
LOW-COST INVESTMENT PLAN Investors may purchase their
initial shares of stock through NAIC’s Low-Cost Investment
Plan. For details contact:
National Association of Investors Corporation (NAIC)
711 West Thirteen Mile Road
Madison Heights, Ml 48071
Phone: (877)ASK-NAIC (275-6242)
www.better-investing.org
FINANCIAL AND OTHER INFORMATION Visit the Investors Page
of the company’s Web site, www.yum.com/investors, for stock
and dividend information and other YUM information of interest
to investors. Earnings and other financial results, corporate
news and company information are also available online.
Copies of Yum! Brands’ SEC Forms 8-K, 10-K and 10-Q and
quarterly earnings releases are available free of charge. Con-
tact Yum! Brands’ Shareholder Relations at (888)298-6986
or e-mail [email protected]
Securities analysts, portfolio managers, representatives
of financial institutions and other individuals with questions
regarding Yum! Brands’ performance are invited to contact:
Tim Jerzyk
Senior Vice President, Investor Relations/Treasurer
Yum! Brands, Inc.
1441 Gardiner Lane
Louisville, KY 40213
Phone: (502)874-8006
INDEPENDENT AUDITORS
KPMG LLP
400 West Market Street, Suite 2600
Louisville, KY 40202
Phone: (502)587-0535
Capital Stock Information
The following table sets forth the high and low stock prices,as
well as cash dividends declared on common stock, for each
quarter in the two-year period ended December 29, 2007:
Design: Sequel Studio, New York Photography: Paul Elledge Photography
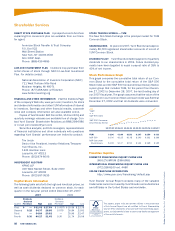
12/27/02 12/26/03 12/23/04 12/30/05 12/29/06 12/28/07
YUM!
S&P 500 Index
S&P 500 Consumer
Discretionary Sector
STOCK TRADING SYMBOL — YUM
The New York Stock Exchange is the principal market for YUM
Common Stock.
SHAREHOLDERS At year-end 2007, Yum! Brands had approxi-
mately 85,000 registered shareholder accounts of record of
YUM Common Stock.
DIVIDEND POLICY Yum! Brands initiated payment of quarterly
dividends to our shareholders in 2004. Future dividend pay-
ments have been targeted to equal a payout ratio of 35% to
40% of net income.
YUM $ 100 $ 140 $ 193 $ 197 $ 250 $ 333
S&P 500 $ 100 $ 125 $ 138 $ 143 $ 162 $ 169
S&P Consumer
Discretionary $ 100 $ 137 $ 153 $ 144 $ 169 $ 145
The papers, paper mills and printer utilized in the production
of this Annual Report are all certified to Forest Stewardship
Council (FSC) standards, which promote environmentally appro-
priate, socially beneficial and economically viable management
of the world’s forests.
Franchise Inquiries
DOMESTIC FRANCHISING INQUIRY PHONE LINE
(866)2YUMYUM (298-6986)
INTERNATIONAL FRANCHISING INQUIRY PHONE LINE
(972)338-8100 ext. 4480
ONLINE FRANCHISE INFORMATION
http://www.yum.com/franchising/default.asp
Yum! Brands’ Annual Report contains many of the valuable
trademarks owned and used by Yum! Brands and subsidiaries
and affiliates in the United States and worldwide.
2007 2006
Dividends Dividends
Declared Declared
Quarter Per Share High Low Per Share High Low
First $ — $ 31.03 $ 27.69 $ 0.0575 $ 25.59 $ 23.38
Second 0.15 34.37 28.85 0.075 26.84 23.83
Third — 34.80 29.62 — 25.96 22.47
Fourth 0.30 40.27 31.45 0.30331.74 25.59
Stock Performance Graph
This graph compares the cumulative total return of our Com-
mon Stock to the cumulative total return of the S&P 500
Stock Index and the S&P 500 Consumer DiscretionarySector,
a peer group that includes YUM, for the period from Decem-
ber 27, 2002 to December 28, 2007, the last trading day of
our 2007 fiscal year. The graph assumes that the value of the
investment in our Common Stock and each index was $100 at
December 27, 2002 and that all dividends were reinvested.