Pizza Hut 2007 Annual Report Download - page 58
Download and view the complete annual report
Please find page 58 of the 2007 Pizza Hut annual report below. You can navigate through the pages in the report by either clicking on the pages listed below, or by using the keyword search tool below to find specific information within the annual report.62 YUM! BRANDS, INC.
FISCAL YEAR Our fiscal year ends on the last Saturday in
December and, as a result, a 53rd week is added every five or
six years. Fiscal year 2005 included 53 weeks. The first three
quarters of each fiscal year consist of 12 weeks and the fourth
quarter consists of 16 weeks in fiscal years with 52 weeks and
17 weeks in fiscal years with 53 weeks. In fiscal year 2005, the
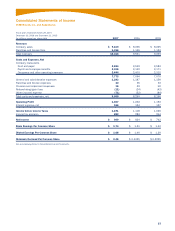
53rd week added $96 million to total revenues and $23 million
to total operating profit in our Consolidated Statement of Income.
Our subsidiaries operate on similar fiscal calendars with period
or month end dates suited to their businesses. The subsidiaries’
period end dates are within one week of YUM’s period end date
with the exception of all of our international businesses except
China. The international businesses except China close one
period or one month earlier to facilitate consolidated reporting.
RECLASSIFICATIONS We have reclassified certain items in the
accompanying Consolidated Financial Statements and Notes
thereto for prior periods to be comparable with the classification
for the fiscal year ended December 29, 2007. These reclassifica-
tions had no effect on previously reported net income.
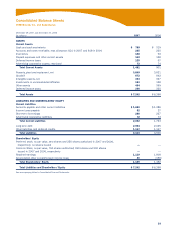
Specifically, we reclassified $15 million for the cumulative
impact of excess tax benefits from prior year exercises of share-
based compensation that were inappropriately recognized as
Deferred income taxes in 2006 to Common Stock. This correc-
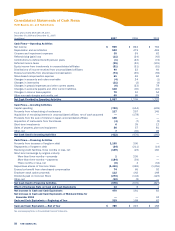
tion also resulted in Net Cash Provided by Operating Activities
decreasing by $3 million and $5 million versus previously reported
amounts for the years ended 2006 and 2005, respectively, with
an offsetting impact to Net Cash Used in Financing Activities.
Additionally, we have netted amounts previously presented
as Wrench litigation (income) expense and AmeriServe and other
charges (credits) in our Consolidated Statements of Income for
2006 and 2005 and included those amounts in Other (income)
expense in the current year presentation. These two items
resulted in a $1 million and $4 million increase in Other (income)
expense in 2006 and 2005, respectively.
FRANCHISE AND LICENSE OPERATIONS We execute franchise
or license agreements for each unit which set out the terms of our
arrangement with the franchisee or licensee. Our franchise and
license agreements typically require the franchisee or licensee to
pay an initial, non-refundable fee and continuing fees based upon
a percentage of sales. Subject to our approval and their payment
of a renewal fee, a franchisee may generally renew the franchise
agreement upon its expiration.
We incur expenses that benefit both our franchise and
license communities and their representative organizations and
our Company operated restaurants. These expenses, along with
other costs of servicing of franchise and license agreements
are charged to general and administrative (“G&A”) expenses as
incurred. Certain direct costs of our franchise and license opera-
tions are charged to franchise and license expenses. These costs
include provisions for estimated uncollectible fees, franchise and
license marketing funding, amortization expense for franchise
related intangible assets and certain other direct incremental
franchise and license support costs.
We monitor the financial condition of our franchisees and
licensees and record provisions for estimated losses on receiv-
ables when we believe that our franchisees or licensees are unable
to make their required payments. While we use the best informa-
tion available in making our determination, the ultimate recovery
of recorded receivables is also dependent upon future economic
events and other conditions that may be beyond our control. Net
provisions for uncollectible franchise and license receivables of
$2 million, $2 million and $3 million were included in Franchise
and license expenses in 2007, 2006 and 2005, respectively.
REVENUE RECOGNITION Our revenues consist of sales by Com-
pany operated restaurants and fees from our franchisees and
licensees. Revenues from Company operated restaurants are
recognized when payment is tendered at the time of sale. The
Company presents sales net of sales tax and other sales related
taxes. We recognize initial fees received from a franchisee or
licensee as revenue when we have performed substantially all ini-
tial services required by the franchise or license agreement, which
is generally upon the opening of a store. We recognize continuing
fees based upon a percentage of franchisee and licensee sales
as earned. We recognize renewal fees when a renewal agreement
with a franchisee or licensee becomes effective. We include initial
fees collected upon the sale of a restaurant to a franchisee in
refranchising (gain) loss.
DIRECT MARKETING COSTS We charge direct marketing costs
to expense ratably in relation to revenues over the year in which
incurred and, in the case of advertising production costs, in the
year the advertisement is first shown. Deferred direct marketing
costs, which are classified as prepaid expenses, consist of media
and related advertising production costs which will generally be
used for the first time in the next fiscal year and have historically
not been significant. To the extent we participate in advertis-
ing cooperatives, we expense our contributions as incurred. Our
advertising expenses were $556 million, $521 million and $519
million in 2007, 2006 and 2005, respectively. We report sub-
stantially all of our direct marketing costs in occupancy and other
operating expenses.
RESEARCH AND DEVELOPMENT EXPENSES Research and
development expenses, which we expense as incurred, are
reported in G&A expenses. Research and development expenses
were $39 million, $33 million and $33 million in 2007, 2006 and
2005, respectively.
SHARE-BASED EMPLOYEE COMPENSATION We account for
share-based employee compensation in accordance with SFAS
No. 123 (Revised 2004), “Share-Based Payment” (“SFAS 123R”).
SFAS 123R requires all share-based payments to employees,
including grants of employee stock options and stock apprecia-
tion rights (“SARs”), to be recognized in the financial statements
as compensation cost over the service period based on their
fair value on the date of grant. Compensation cost is recognized
over the service period on a straight-line basis for the fair value
of awards that actually vest.
IMPAIRMENT OR DISPOSAL OF LONG-LIVED ASSETS In accor-
dance with SFAS No. 144, “Accounting for the Impairment or
Disposal of Long-Lived Assets” (“SFAS 144”), we review our
long-lived assets related to each restaurant that we are currently
operating and have not offered to refranchise, including any allo-
cated intangible assets subject to amortization, semi-annually
for impairment, or whenever events or changes in circumstances
indicate that the carrying amount of a restaurant may not be
recoverable. We evaluate restaurants using a “two-year history
of operating losses” as our primary indicator of potential impair-
ment. Based on the best information available, we write down
an impaired restaurant to its estimated fair market value, which
becomes its new cost basis. We generally measure estimated
fair market value by discounting estimated future cash flows.


