Pizza Hut 2007 Annual Report Download - page 31
Download and view the complete annual report
Please find page 31 of the 2007 Pizza Hut annual report below. You can navigate through the pages in the report by either clicking on the pages listed below, or by using the keyword search tool below to find specific information within the annual report.-
 1
1 -
2
-
3
-
4
-
5
-
6
-
7
-
8
-
9
-
10
-
11
-
12
-
13
-
14
-
15
-
16
-
17
-
18
-
19
-
20
-
 21
21 -
 22
22 -
 23
23 -
 24
24 -
 25
25 -
 26
26 -
 27
27 -
 28
28 -
 29
29 -
 30
30 -
 31
31 -
 32
32 -
 33
33 -
 34
34 -
 35
35 -
 36
36 -
 37
37 -
 38
38 -
 39
39 -
 40
40 -
 41
41 -
42
-
43
-
44
-
45
-
46
-
47
-
48
-
49
-
50
-
51
-
52
-
53
-
54
-
55
-
56
-
57
-
58
-
59
-
60
-
61
-
62
-
63
-
64
-
65
-
66
-
67
-
68
-
69
-
70
-
71
-
72
-
73
-
74
-
75
-
76
-
77
-
78
-
79
-
80
-
81
-
82
-
83
-
84
-
85
-
86
 |
 |

3535
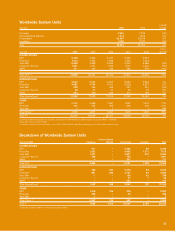
Worldwide System Units
%B/(W)
Year-end 2007 2006 Change
Company7,625 7,736 (1%)
Unconsolidated affiliates 1,3141,206 9%
Franchisees 24,297 23,516 3%
Licensees 2,109 2,137 (1%)
Total 35,345 34,595 2%
5-Year
Year-end 2007 2006 2005 2004 2003 Growth(a)
UNITED STATES
KFC 5,358 5,394 5,443 5,525 5,524 –
Pizza Hut 7,515 7,532 7,566 7,500 7,523 –
Taco Bell 5,580 5,608 5,845 5,900 5,989 (2%)
Long John Silver’s1,0811,121 1,169 1,200 1,204 (2%)
A&W 371 406 449 485 576 (11%)
Total U.S. (b) 19,905 20,06120,472 20,610 20,822 (1%)
INTERNATIONAL
KFC 6,942 6,606 6,307 6,084 5,944 4%
Pizza Hut 4,882 4,788 4,7014,528 4,357 3%
Taco Bell 238 236 243 237 247 (2%)
Long John Silver’s38 35 34 34 31 6%
A&W 254 238 229 210 183 7%
Total International 12,354 11,903 11,514 11,093 10,762 3%
CHINA
KFC 2,592 2,258 1,981 1,657 1,410 17%
Pizza Hut 480 365 305 246 204 21%
Taco Bell 2 2 2 1 1 NM
Total China (c)3,086 2,6312,291 1,905 1,615 18%
Total (b)(c)35,345 34,595 34,277 33,608 33,199 2%
(a) Compounded annual growth rate; total U.S., International and Worldwide excludes the impact of Long John Silver’sand A&W.
(b) Includes 6 Yan Can units in 2003.
(c) Includes 12units, 6units, 3units and 1unitin2007,2006 and 2005, and 2004, respectively,for an Asian food concept in China.
Breakdown of Worldwide System Units
Unconsolidated
Year-end 2007 Company Affiliate Franchised Licensed Total
UNITED STATES
KFC 971 –4,302 85 5,358
Pizza Hut 1,292 –4,852 1,371 7,515
Taco Bell 1,301 –3,807 472 5,580
Long John Silver’s328 –753 – 1,081
A&W 4 – 367 –371
Total U.S. 3,896 – 14,081 1,928 19,905
INTERNATIONAL
KFC 750 366 5,770 56 6,942
Pizza Hut 891202 3,707 82 4,882
Taco Bell 1 – 195 42 238
Long John Silver’s– – 37 138
A&W – – 254 –254
Total International 1,642 568 9,963 181 12,354
CHINA
KFC 1,618 746 228 –2,592
Pizza Hut 455 –25 –480
Taco Bell 2 – – – 2
Total China (a)2,087 746 253 –3,086
Total (a)7,625 1,314 24,297 2,109 35,345
(a) Includes 12units in 2007 foranAsian food concept in China.