Pizza Hut 2007 Annual Report Download - page 30
Download and view the complete annual report
Please find page 30 of the 2007 Pizza Hut annual report below. You can navigate through the pages in the report by either clicking on the pages listed below, or by using the keyword search tool below to find specific information within the annual report.-
 1
1 -
2
-
3
-
4
-
5
-
6
-
7
-
8
-
9
-
10
-
11
-
12
-
13
-
14
-
15
-
16
-
17
-
18
-
19
-
 20
20 -
 21
21 -
 22
22 -
 23
23 -
 24
24 -
 25
25 -
 26
26 -
 27
27 -
 28
28 -
 29
29 -
 30
30 -
 31
31 -
 32
32 -
 33
33 -
 34
34 -
 35
35 -
 36
36 -
 37
37 -
 38
38 -
 39
39 -
 40
40 -
41
-
42
-
43
-
44
-
45
-
46
-
47
-
48
-
49
-
50
-
51
-
52
-
53
-
54
-
55
-
56
-
57
-
58
-
59
-
60
-
61
-
62
-
63
-
64
-
65
-
66
-
67
-
68
-
69
-
70
-
71
-
72
-
73
-
74
-
75
-
76
-
77
-
78
-
79
-
80
-
81
-
82
-
83
-
84
-
85
-
86
 |
 |

Worldwide Sales
5-Year
(In Billions) 2007 2006 2005 2004 2003 Growth(a)
UNITED STATES
KFC
Companysales $ 1.2 $ 1.4 $ 1.4 $ 1.4 $ 1.4 (3%)
Franchiseesales (b) 4.13.9 3.8 3.6 3.5 3%
PH
Companysales $ 1.3 $ 1.4 $ 1.6 $ 1.6 $ 1.6 (3%)
Franchiseesales (b) 4.13.8 3.7 3.6 3.5 2%
TACO BELL
Companysales $ 1.7 $ 1.8 $ 1.8 $ 1.7 $ 1.6 2%
Franchiseesales (b) 4.4 4.5 4.4 4.0 3.8 4%
LONG JOHN SILVER’S
Companysales $0.3 $0.4 $0.5 $0.5 $0.5 NM
Franchiseesales (b) 0.5 0.4 0.3 0.3 0.3 NM
A&W
Companysales $ – $ – $ – $ – $ – NM
Franchiseesales (b) 0.2 0.2 0.2 0.2 0.2 NM
TOTAL U.S.
Companysales $4.5 $5.0 $5.3 $5.2 $5.1 (1%)
Franchiseesales (b) 13.3 12.8 12.4 11.7 11.3 3%
INTERNATIONAL
KFC
Companysales $ 1.3 $ 1.1 $ 1.1 $ 1.0 $0.9 9%
Franchiseesales (b) 6.7 5.7 5.2 4.7 4.1 13%
PIZZA HUT
Companysales (c) $ 1.2 $0.7 $0.6 $0.7 $0.5 18%
Franchiseesales (b) 3.0 3.13.0 2.6 2.4 7%
TACO BELL
Companysales $ – $ – $ – $ – $ – NM
Franchiseesales (b) 0.2 0.2 0.2 0.2 0.1 13%
LONG JOHN SILVER’S
Companysales $ – $ – $ – $ – $ – NM
Franchiseesales (b) –––––NM
A&W
Companysales $ – $ – $ – $ – $ – NM
Franchiseesales (b) 0.10.10.10.10.1NM
TOTAL INTERNATIONAL
Companysales $2.5 $ 1.8 $ 1.7 $ 1.7 $ 1.4 12%
Franchiseesales (b) 10.0 9.18.5 7.6 6.7 11%
CHINA
KFC
Companysales $ 1.7 $ 1.3 $ 1.0 $0.9 $0.8 22%
Franchiseesales (b) 1.1 0.8 0.7 0.6 0.5 24%
PIZZA HUT
Companysales $0.4 $0.3 $0.2 $0.2 $0.1NM
Franchiseesales (b) –––––NM
TOTAL CHINA
Companysales $2.1$ 1.6 $ 1.2 $ 1.1 $ 0.9 24%
Franchiseesales (b) 1.1 0.8 0.7 0.6 0.5 23%
TOTAL WORLDWIDE
Companysales $9.1$8.4 $8.2 $8.0 $ 7.4 6%
Franchiseesales (b) 24.4 22.7 21.6 19.9 18.5 7%
(a) Compounded annual growth rate; totals for U.S., International and Worldwide exclude the impact of Long JohnSilver’s and A&W.
(b) Franchisee sales represents the combined estimated sales of unconsolidated affiliate and franchise and license restaurants. Franchisee sales, which are not included in our Company sales,
generatefranchise and license fees (typically at rates between 4% and 6%) that are included in our revenues.
(c) For years 2007 and 2006, Company sales for the International Division includes the impact of the acquisition of the remaining 50% ownership interest of our Pizza Hut U.K. unconsolidated affiliate.
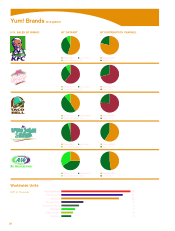
For the sixth straight year,wemet our commitment to deliver EPS growth of at least 10%, delivering
15% growth in 2007. As you can see, we take our commitments to our shareholders very seriously,and
consistency of performance is atop priority. Wecontinued to expand our business around the world,
opening arecord 471 new units in Mainland China and a record 852 units in YRI.By once again adding
more new international units than any other restaurant company, Yum! continues to improve its
competitive position. In 2007, we returned arecord $1.7billion to our shareholders, withshare repur-
chases of $1.4 billion and dividends of almost $300 million. Overall, you can expect that in 2008, Yum!
Brands will once again prove we arenot your ordinary restaurant company and will continue to WIN BIG
around the globe! Rick Carucci, Chief Financial Officer, Yum! Brands, Inc.