Pizza Hut 2007 Annual Report Download - page 41
Download and view the complete annual report
Please find page 41 of the 2007 Pizza Hut annual report below. You can navigate through the pages in the report by either clicking on the pages listed below, or by using the keyword search tool below to find specific information within the annual report.-
 1
1 -
2
-
3
-
4
-
5
-
6
-
7
-
8
-
9
-
10
-
11
-
12
-
13
-
14
-
15
-
16
-
17
-
18
-
19
-
20
-
21
-
22
-
23
-
24
-
25
-
26
-
27
-
28
-
29
-
30
-
 31
31 -
 32
32 -
 33
33 -
 34
34 -
 35
35 -
 36
36 -
 37
37 -
 38
38 -
 39
39 -
 40
40 -
 41
41 -
 42
42 -
 43
43 -
 44
44 -
 45
45 -
 46
46 -
 47
47 -
 48
48 -
 49
49 -
 50
50 -
 51
51 -
52
-
53
-
54
-
55
-
56
-
57
-
58
-
59
-
60
-
61
-
62
-
63
-
64
-
65
-
66
-
67
-
68
-
69
-
70
-
71
-
72
-
73
-
74
-
75
-
76
-
77
-
78
-
79
-
80
-
81
-
82
-
83
-
84
-
85
-
86
 |
 |

45
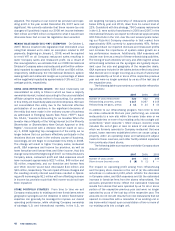
Interest Expense, Net
2007 2006 2005
Interest expense $ 199 $ 172 $ 147
Interest income (33) (18) (20)
Interest expense, net $ 166 $ 154 $ 127
Net interest expense increased $12 million or 8% in 2007.
The increase was driven by an increase in borrowings in 2007
compared to 2006, partially offset by an increase in interest
bearing cash equivalents in 2007 compared to 2006. Net
interest expense increased $27 million or 21% in 2006. The
increase was driven by both an increase in interest rates on
the variable rate portion of our debt and increased borrowings
as compared to prior year.
Income Taxes
2007 2006 2005
Reported
Income taxes $ 282 $ 284 $ 264
Effective tax rate 23.7% 25.6% 25.8%
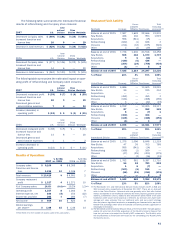
The reconciliation of income taxes calculated at the U.S. fed-
eral tax statutory rate to our effective tax rate is set forth
below:
2007 2006 2005
U.S. federal statutory rate 35.0% 35.0% 35.0%
State income tax, net of federal
tax benefit 1.0 2.0 1.6
Foreign and U.S. tax effects
attributable to foreign operations (5.7) (7.8) (8.4)
Adjustments to reserves and
prior years 2.6 (3.5) (1.1)
Repatriation of foreign earnings —(0.4) 2.0
Non-recurring foreign tax credit
adjustments —(6.2) (1.7)
Valuation allowance additions
(reversals) (9.0) 6.8 (1.1)
Other, net (0.2) (0.3) (0.5)
Effective income tax rate 23.7% 25.6% 25.8%
Our 2007 effective income tax rate was positively impacted
by valuation allowance reversals. In December 2007, the
Company finalized various tax planning strategies based on
completing a review of our international operations,distributed
a $275 million intercompany dividend and sold our interest in
our Japan unconsolidated affiliate. As a result, in the fourth
quarter of 2007, we reversed approximately $82 million of
valuation allowances associated with foreign tax credit car-
ryovers that we now believe are more likely than not to be
claimed on future tax returns. In 2007, benefits associated
with our foreign and U.S. tax effects attributable to foreign
operations were negatively impacted by $36 million of expense
associated with the $275 million intercompany dividend and
approximately $20 million of expense for adjustments to our
deferred tax balances as a result of the Mexico tax law change
enacted during the fourth quarter of 2007. These negative
impacts were partially offset by a higher percentage of our
income being earned outside the U.S. Additionally, the effec-
tive tax rate was negatively impacted by the year-over-year
change in adjustments to reserves and prior years.
Our 2006 effective income tax rate was positively impacted
by the reversal of tax reserves in connection with our regular
U.S. audit cycle as well as certain out-of-year adjustments to
reserves and accruals that lowered our effective income tax
rate by 2.2 percentage points. The reversal of tax reserves
was partially offset by valuation allowance additions on foreign
tax credits for which, as a result of the tax reserve reversals,
we believed were not likely to be utilized before they expired.
We also recognized deferred tax assets for the foreign tax
credit impact of non-recurring decisions to repatriate certain
foreign earnings in 2007. However, we provided full valuation
allowances on such assets as we did not believe it was more
likely than not that they would be realized at that time.
Our 2005 effective income tax rate was positively
impacted by valuation allowance reversals for certain deferred
tax assets whose realization became more likely than not as
well as the recognition of certain non-recurring foreign tax
credits we were able to substantiate in 2005. The impact of
these items was partially offset by tax expense associated
with our 2005 decision to repatriate approximately $390 mil-
lion in qualified foreign earnings. These earnings were eligible
for a dividends received deduction in accordance with the
American Jobs Creation Act of 2004.
Adjustments to reserves and prior years include the
effects of the reconciliation of income tax amounts recorded in
our Consolidated Statements of Income to amounts reflected
on our tax returns, including any adjustments to the Con-
solidated Balance Sheets. Adjustments to reserves and prior
years also includes changes in tax reserves, including inter-
est thereon, established for potential exposure we may incur
if a taxing authority takes a position on a matter contrary
to our position. We evaluate these reserves on a quarterly
basis to insure that they have been appropriately adjusted
for events, including audit settlements that we believe may
impact our exposure.
Consolidated Cash Flows
Net cash provided by operating activities was $1,567 mil-
lion compared to $1,299 million in 2006. The increase was
primarily driven by higher net income, lower pension contribu-
tions and lower income tax payments in 2007.
In 2006, net cash provided by operating activities was
$1,299 million compared to $1,233 million in 2005. The
increase was driven by a higher net income, lower pension
contributions and a 2006 partial receipt of the settlement
related to the 2005 mainland China supplier ingredient issue.
These factors were offset by higher income tax and interest
payments in 2006.
Net cash used in investing activities was $432 million versus
$476 million in 2006. The decrease was driven by the lapping
of the acquisition of the remaining interest in our Pizza Hut
U.K. unconsolidated affiliate in 2006 and proceeds from the
sale of our interest in the Japan unconsolidated affiliate in
December 2007, partially offset by the year over year change
in proceeds from refranchising of restaurants and a 2007
increase in capital spending.