Pizza Hut 2007 Annual Report Download - page 32
Download and view the complete annual report
Please find page 32 of the 2007 Pizza Hut annual report below. You can navigate through the pages in the report by either clicking on the pages listed below, or by using the keyword search tool below to find specific information within the annual report.-
 1
1 -
2
-
3
-
4
-
5
-
6
-
7
-
8
-
9
-
10
-
11
-
12
-
13
-
14
-
15
-
16
-
17
-
18
-
19
-
20
-
21
-
 22
22 -
 23
23 -
 24
24 -
 25
25 -
 26
26 -
 27
27 -
 28
28 -
 29
29 -
 30
30 -
 31
31 -
 32
32 -
 33
33 -
 34
34 -
 35
35 -
 36
36 -
 37
37 -
 38
38 -
 39
39 -
 40
40 -
 41
41 -
 42
42 -
43
-
44
-
45
-
46
-
47
-
48
-
49
-
50
-
51
-
52
-
53
-
54
-
55
-
56
-
57
-
58
-
59
-
60
-
61
-
62
-
63
-
64
-
65
-
66
-
67
-
68
-
69
-
70
-
71
-
72
-
73
-
74
-
75
-
76
-
77
-
78
-
79
-
80
-
81
-
82
-
83
-
84
-
85
-
86
 |
 |
36
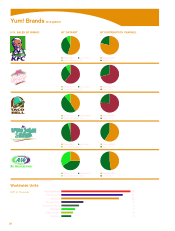
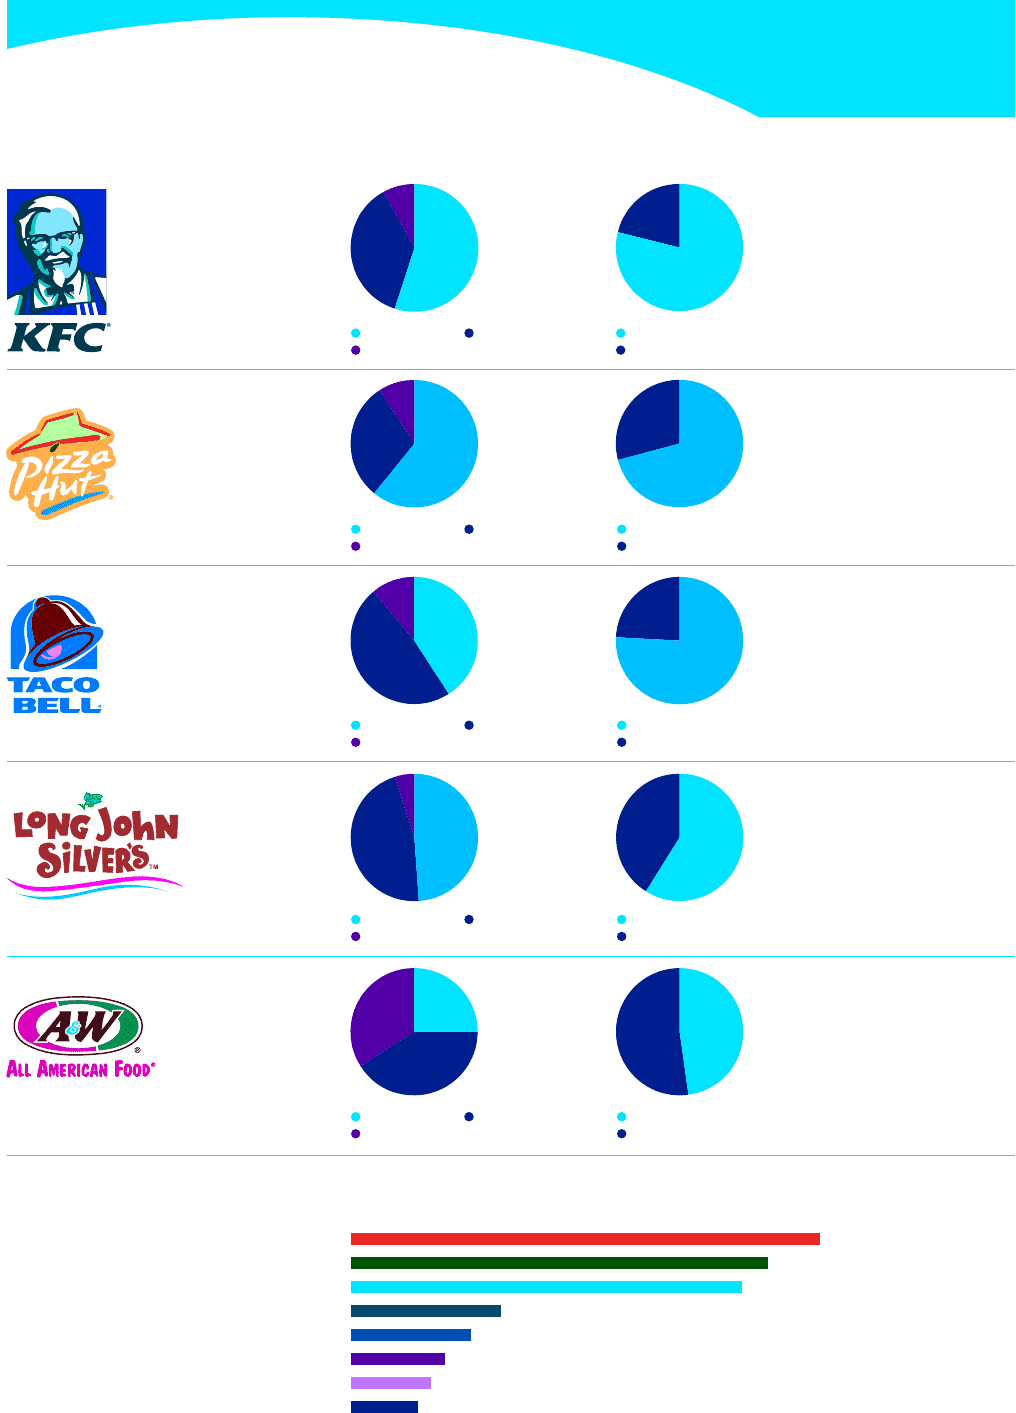
Dinner 55% Lunch 37%
Snacks/Breakfast 8%
Dine Out 79%
Dine In 21%
Dinner 61% Lunch 30%
Snacks/Breakfast 9%
Dine Out 71%
Dine In 29%
Dinner 41% Lunch 48%
Snacks/Breakfast 11%
Dine Out 76%
Dine In 24%
Dinner 49% Lunch 46%
Snacks/Breakfast 5%
Dine Out 59%
Dine In 41%
Dinner 25% Lunch 41%
Snacks/Breakfast 34%
Dine Out 48%
Dine In 52%
U.S. SALES BY BRAND BY DAYPART BY DISTRIBUTION CHANNEL
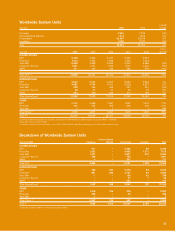
Worldwide Units
Yum! Brands at-a-glance
Yum! Brands
McDonald’s
Subway
Burger King
Domino’sPizza
Wendy’s
Dairy Queen
Quiznos
35
31
29
11
9
7
6
5
Source: TheNPDGroup, Inc.; NPDFoodworld; CREST
2007 (InThousands)