Pizza Hut 2007 Annual Report Download - page 54
Download and view the complete annual report
Please find page 54 of the 2007 Pizza Hut annual report below. You can navigate through the pages in the report by either clicking on the pages listed below, or by using the keyword search tool below to find specific information within the annual report.-
 1
1 -
2
-
3
-
4
-
5
-
6
-
7
-
8
-
9
-
10
-
11
-
12
-
13
-
14
-
15
-
16
-
17
-
18
-
19
-
20
-
21
-
22
-
23
-
24
-
25
-
26
-
27
-
28
-
29
-
30
-
31
-
32
-
33
-
34
-
35
-
36
-
37
-
38
-
39
-
40
-
41
-
42
-
43
-
 44
44 -
 45
45 -
 46
46 -
 47
47 -
 48
48 -
 49
49 -
 50
50 -
 51
51 -
 52
52 -
 53
53 -
 54
54 -
 55
55 -
 56
56 -
 57
57 -
 58
58 -
 59
59 -
 60
60 -
 61
61 -
 62
62 -
 63
63 -
 64
64 -
65
-
66
-
67
-
68
-
69
-
70
-
71
-
72
-
73
-
74
-
75
-
76
-
77
-
78
-
79
-
80
-
81
-
82
-
83
-
84
-
85
-
86
 |
 |

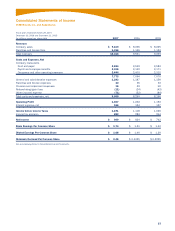
58 YUM! BRANDS, INC.
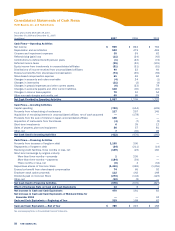
Consolidated Statements of Cash Flows
YUM! Brands, Inc. and Subsidiaries
Fiscal years ended December 29, 2007,
December 30, 2006 and December 31, 2005
(in millions) 2007 2006 2005
Cash Flows—Operating Activities
Net income $ 909 $ 824 $ 762
Depreciation and amortization 542 479 469
Closures and impairment expenses 35 59 62
Refranchising (gain) loss (11) (24) (43)
Contributions to defined benefit pension plans (1) (43) (74)
Deferred income taxes (95) (30) (101)
Equity income from investments in unconsolidated affiliates (51) (51) (51)
Distributions of income received from unconsolidated affiliates 40 32 44
Excess tax benefits from share-based compensation (74) (65) (92)
Share-based compensation expense 61 65 62
Changes in accounts and notes receivable (4) 24 (1)
Changes in inventories (31) (3) (4)
Changes in prepaid expenses and other current assets (6) (33) 78
Changes in accounts payable and other current liabilities 118 (30) (10)
Changes in income taxes payable 70 10 54
Other non-cash charges and credits, net 65 85 78
Net Cash Provided by Operating Activities 1,567 1,299 1,233
Cash Flows—Investing Activities
Capital spending (742) (614) (609)
Proceeds from refranchising of restaurants 117 257 145
Acquisition of remaining interest in unconsolidated affiliate, net of cash assumed —(178) —
Proceeds from the sale of interest in Japan unconsolidated affiliate 128 — —
Acquisition of restaurants from franchisees (4) (7) (2)
Short-term investments 639 12
Sales of property, plant and equipment 56 57 81
Other, net 7(30) 28
Net Cash Used in Investing Activities (432) (476) (345)
Cash Flows—Financing Activities
Proceeds from issuance of long-term debt 1,195 300 —
Repayments of long-term debt (24) (211) (14)
Revolving credit facilities, three months or less, net (149) (23) 160
Short-term borrowings by original maturity
More than three months—proceeds 1236 —
More than three months—payments (184) (54) —
Three months or less, net (8) 4 (34)
Repurchase shares of Common Stock (1,410) (983) (1,056)
Excess tax benefit from share-based compensation 74 65 92
Employee stock option proceeds 112 142 148
Dividends paid on Common Stock (273) (144) (123)
Other, net (12) (2) —
Net Cash Used in Financing Activities (678) (670) (827)
Effect of Exchange Rate on Cash and Cash Equivalents 13 8 1
Net Increase in Cash and Cash Equivalents 470 161 62
Net Increase in Cash and Cash Equivalents of Mainland China for
December 2004 — — 34
Cash and Cash Equivalents—Beginning of Year 319 158 62
Cash and Cash Equivalents—End of Year $ 789 $ 319 $ 158
See accompanying Notes to Consolidated Financial Statements.