Pizza Hut 2007 Annual Report Download - page 71
Download and view the complete annual report
Please find page 71 of the 2007 Pizza Hut annual report below. You can navigate through the pages in the report by either clicking on the pages listed below, or by using the keyword search tool below to find specific information within the annual report.-
 1
1 -
2
-
3
-
4
-
5
-
6
-
7
-
8
-
9
-
10
-
11
-
12
-
13
-
14
-
15
-
16
-
17
-
18
-
19
-
20
-
21
-
22
-
23
-
24
-
25
-
26
-
27
-
28
-
29
-
30
-
31
-
32
-
33
-
34
-
35
-
36
-
37
-
38
-
39
-
40
-
41
-
42
-
43
-
44
-
45
-
46
-
47
-
48
-
49
-
50
-
51
-
52
-
53
-
54
-
55
-
56
-
57
-
58
-
59
-
60
-
 61
61 -
 62
62 -
 63
63 -
 64
64 -
 65
65 -
 66
66 -
 67
67 -
 68
68 -
 69
69 -
 70
70 -
 71
71 -
 72
72 -
 73
73 -
 74
74 -
 75
75 -
 76
76 -
 77
77 -
 78
78 -
 79
79 -
 80
80 -
 81
81 -
82
-
83
-
84
-
85
-
86
 |
 |

75
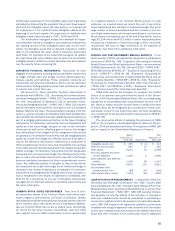
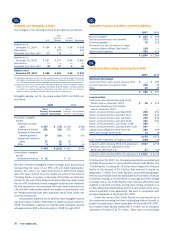
PLAN ASSETS Our pension plan weighted-average asset allo-
cations at the measurement dates, by asset category are set
forth below:
U.S. International
Pension Plans Pension Plans
Asset Category 2007 2006 2007 2006
Equity securities 71% 70% 80% 80%
Debt securities 29 30 20 20
Total 100% 100% 100% 100%
Our primary objectives regarding the Plan’s assets, which make
up 84% of total pension plan assets at the 2007 measurement
dates, are to optimize return on assets subject to acceptable risk
and to maintain liquidity, meet minimum funding requirements
and minimize plan expenses. To achieve these objectives, we
have adopted a passive investment strategy in which the asset
performance is driven primarily by the investment allocation. Our
target investment allocation is 70% equity securities and 30%
debt securities, consisting primarily of low cost index mutual
funds that track several sub-categories of equity and debt secu-
rity performance. The investment strategy is primarily driven by
our Plan’s participants’ ages and reflects a long-term investment
horizon favoring a higher equity component in the investment
allocation.
A mutual fund held as an investment by the Plan includes
YUM stock in the amount of $0.4 million at September 30, 2007
and 2006 (less than 1% of total plan assets in each instance).
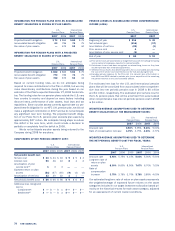
BENEFIT PAYMENTS The benefits expected to be paid in each
of the next five years and in the aggregate for the five years
thereafter are set forth below:
U.S. International
Year ended: Pension Plans Pension Plans
2008 $ 43 $ 2
2009 34 2
2010 36 2
2011 39 2
2012 42 2
2013–2017 263 12
Expected benefits are estimated based on the same assump-
tions used to measure our benefit obligation on the measurement
date and include benefits attributable to estimated further
employee service.
POSTRETIREMENT MEDICAL BENEFITS Our postretirement
plan provides health care benefits, principally to U.S. salaried
retirees and their dependents, and includes retiree cost sharing
provisions. During 2001, the plan was amended such that any
salaried employee hired or rehired by YUM after September 30,
2001 is not eligible to participate in this plan. Employees hired
prior to September 30, 2001 are eligible for benefits if they meet
age and service requirements and qualify for retirement benefits.
We fund our postretirement plan as benefits are paid.
At the end of 2007 and 2006, the accumulated postretire-
ment benefit obligation is $73 million and $68 million,respectively.
The unrecognized actuarial loss recognized in Accumulated other
comprehensive loss is $9 million at the end of 2007 and $4 mil-
lion at the end of 2006. The net periodic benefit cost recorded in
2007, 2006 and 2005 was $5 million, $6 million and $8 million,
respectively, the majority of which is interest cost on the accu-
mulated postretirement benefit obligation. The weighted-average
assumptions used to determine benefit obligations and net peri-
odic benefit cost for the postretirement medical plan are identical
to those as shown for the U.S. pension plans. Our assumed heath
care cost trend rates for the following year as of 2007 and 2006
are 8.0% and 9.0%, respectively, both with an expected ultimate
trend rate of 5.5% reached in 2012.
There is a cap on our medical liability for certain retirees. The
cap for Medicare eligible retirees was reached in 2000 and the cap
for non-Medicare eligible retirees is expected to be reached in
2011; once the cap is reached, our annual cost per retiree will
not increase. A one-percentage-point increase or decrease in
assumed health care cost trend rates would have less than a
$1 million impact on total service and interest cost and on the
post retirement benefit obligation. The benefits expected to be
paid in each of the next five years are approximately $6 million
and in aggregate for the five years thereafter are $33 million.
17.
Stock Options and Stock Appreciation Rights
At year end 2007, we had four stock award plans in effect: the
YUM! Brands, Inc. Long-Term Incentive Plan (“1999 LTIP”), the
1997 Long-Term Incentive Plan (“1997 LTIP”), the YUM! Brands,
Inc. Restaurant General Manager Stock Option Plan (“RGM Plan”)
and the YUM! Brands, Inc. SharePower Plan (“SharePower”).
Under all our plans, the exercise price of stock options and stock
appreciation rights (“SARs”) granted must be equal to or greater
than the average market price or the ending market price of the
Company’s stock on the date of grant.
We may grant awards of up to 59.6 million shares and
90.0 million shares of stock under the 1999 LTIP, as amended,
and 1997 LTIP, respectively. Potential awards to employees and
non-employee directors under the 1999 LTIP include stock options,
incentive stock options, SARs, restricted stock, stock units,
restricted stock units,performance shares and performance units.
Potential awards to employees and non-employee directors under
the 1997 LTIP include restricted stock and performance restricted
stock units. Prior to January 1, 2002, we also could grant stock
options, incentive stock options and SARs under the 1997 LTIP.
Through December 29, 2007, we have issued only stock options
and performance restricted stock units under the 1997 LTIP and
have issued only stock options and SARs under the 1999 LTIP.
While awards under the 1999 LTIP can have varying vesting provi-
sions and exercise periods, previously granted awards under the
1997 LTIP and 1999 LTIP vest in periods ranging from immediate
to 10 years and expire ten to fifteen years after grant.
We may grant awards to purchase up to 30.0 million shares
of stock under the RGM Plan. Potential awards to employees
under the RGM Plan include stock options and SARs. RGM Plan
awards granted have a four year cliff vesting period and expire
ten years after grant. Certain RGM Plan awards are granted
upon attainment of performance conditions in the previous year.
Expense for such awards is recognized over a period that includes
the performance condition period.