Pizza Hut 2007 Annual Report Download - page 39
Download and view the complete annual report
Please find page 39 of the 2007 Pizza Hut annual report below. You can navigate through the pages in the report by either clicking on the pages listed below, or by using the keyword search tool below to find specific information within the annual report.-
 1
1 -
2
-
3
-
4
-
5
-
6
-
7
-
8
-
9
-
10
-
11
-
12
-
13
-
14
-
15
-
16
-
17
-
18
-
19
-
20
-
21
-
22
-
23
-
24
-
25
-
26
-
27
-
28
-
 29
29 -
 30
30 -
 31
31 -
 32
32 -
 33
33 -
 34
34 -
 35
35 -
 36
36 -
 37
37 -
 38
38 -
 39
39 -
 40
40 -
 41
41 -
 42
42 -
 43
43 -
 44
44 -
 45
45 -
 46
46 -
 47
47 -
 48
48 -
 49
49 -
50
-
51
-
52
-
53
-
54
-
55
-
56
-
57
-
58
-
59
-
60
-
61
-
62
-
63
-
64
-
65
-
66
-
67
-
68
-
69
-
70
-
71
-
72
-
73
-
74
-
75
-
76
-
77
-
78
-
79
-
80
-
81
-
82
-
83
-
84
-
85
-
86
 |
 |

43
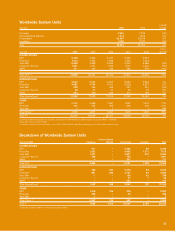
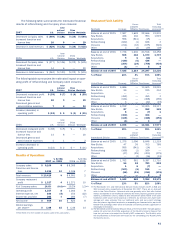
In 2007, U.S. Company same store sales were down 3%
due to transaction declines partially offset by an increase
in average guest check. In 2006, U.S. Company same store
sales were flat as a decrease in transactions was offset by
an increase in average guest check.
In 2007, the increase in U.S. franchise and license fees
was driven by refranchising and new unit development, par-
tially offset by store closures. In 2006, the increase in U.S.
franchise and license fees was driven by new unit develop-
ment, refranchising and same store sales growth, partially
offset by store closures.
Excluding the favorable impact of the Pizza Hut U.K. acqui-
sition, International Division Company sales decreased 1%
in 2007. The decrease was driven by refranchising and store
closures, partially offset by same store sales growth and new
unit development. Excluding the favorable impact of the Pizza
Hut U.K. acquisition, International Division Company sales
were flat in 2006. The impacts of refranchising and store
closures were partially offset by new unit development and
same store sales growth.
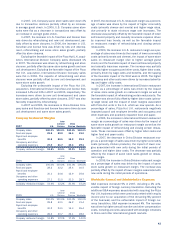
Excluding the unfavorable impact of the Pizza Hut U.K.
acquisition, International Division franchise and license fees
increased 14% and 13% in 2007 and 2006, respectively. The
increases were driven by new unit development and same
store sales, partially offset by store closures. 2007 was also
favorably impacted by refranchising.
In 2007 and 2006, the increases in China Division Com-
pany sales and franchise and license fees were driven by new
unit development and same store sales growth.
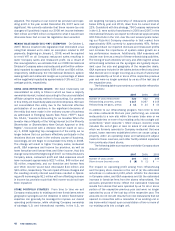
Company Restaurant Margins
Inter-
national China
2007 U.S. Division Division Worldwide
Company sales 100.0% 100.0% 100.0% 100.0%
Food and paper 29.2 29.9 36.4 31.0
Payroll and employee
benefits 30.5 26.1 13.2 25.3
Occupancy and other
operating expenses 27.0 31.7 30.3 29.1
Company restaurant margin 13.3% 12.3% 20.1% 14.6%
Inter-
national China
2006 U.S. Division Division Worldwide
Company sales 100.0% 100.0% 100.0% 100.0%
Food and paper 28.2 32.2 35.4 30.5
Payroll and employee
benefits 30.1 24.6 12.9 25.6
Occupancy and other
operating expenses 27.1 31.0 31.3 28.7
Company restaurant margin 14.6% 12.2% 20.4% 15.2%
Inter-
national China
2005 U.S. Division Division Worldwide
Company sales 100.0% 100.0% 100.0% 100.0%
Food and paper 29.8 33.1 36.2 31.4
Payroll and employee
benefits 30.2 24.1 13.3 26.4
Occupancy and other
operating expenses 26.2 30.7 33.1 28.2
Company restaurant margin 13.8% 12.1% 17.4% 14.0%
In 2007, the decrease in U.S. restaurant margin as a percent-
age of sales was driven by the impact of higher commodity
costs (primarily cheese and meats) and higher wage rates,
due primarily to state minimum wage rate increases. The
decrease was partially offset by the favorable impact of lower
self-insured property and casualty insurance expense driven
by improved loss trends, as well as the favorable impact
on restaurant margin of refranchising and closing certain
restaurants.
In 2006, the increase in U.S. restaurant margin as a per-
centage of sales was driven by the impact of lower commodity
costs (primarily meats and cheese), the impact of same store
sales on restaurant margin (due to higher average guest
check) and the favorable impact of lower self-insured property
and casualty insurance expense. The increase was partially
offset by higher occupancy and other costs,higher labor costs,
primarily driven by wage rates and benefits, and the lapping
of the favorable impact of the 53rd week in 2005. The higher
occupancy and other costs were driven by increased advertis-
ing and higher utility costs.
In 2007, the increase in International Division restaurant
margin as a percentage of sales was driven by the impact
of same store sales growth on restaurant margin as well as
the favorable impact of refranchising certain restaurants. The
increase was almost fully offset by higher labor costs (primar-
ily wage rates) and the impact of lower margins associated
with Pizza Hut units in the U.K. which we now operate. As a
percentage of sales, Pizza Hut U.K. restaurants negatively
impacted payroll and employee benefits and occupancy and
other expenses and positively impacted food and paper.
In 2006, the increase in International Division restaurant
margin as a percentage of sales was driven by the impact of
same store sales growth on restaurant margin as well as the
favorable impact of refranchising and closing certain restau-
rants. These increases were offset by higher labor costs and
higher food and paper costs.
In 2007, the decrease in China Division restaurant mar-
gin as a percentage of sales was driven by higher commodity
costs (primarily chicken products), the impact of lower mar-
gins associated with new units during the initial periods of
operation and higher labor costs. The decrease was partially
offset by the impact of same store sales growth on restau-
rant margin.
In 2006, the increase in China Division restaurant margin
as a percentage of sales was driven by the impact of same
store sales growth on restaurant margin. The increase was
partially offset by the impact of lower margins associated with
new units during the initial periods of operations.
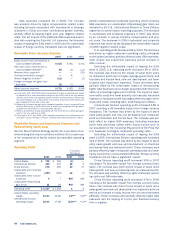
Worldwide General and Administrative Expenses
G&A expenses increased 9% in 2007, including a 2% unfa-
vorable impact of foreign currency translation. Excluding the
additional G&A expenses associated with acquiring the Pizza
Hut U.K. business (which were previously netted within equity
income prior to our acquisition of the remaining fifty percent
of the business) and the unfavorable impact of foreign cur-
rency translation, G&A expense increased 4%. The increase
was driven by higher annual incentive and other compensation
costs, including amounts associated with strategic initiatives
in China and other international growth markets.