Pizza Hut 2007 Annual Report Download - page 33
Download and view the complete annual report
Please find page 33 of the 2007 Pizza Hut annual report below. You can navigate through the pages in the report by either clicking on the pages listed below, or by using the keyword search tool below to find specific information within the annual report.-
 1
1 -
2
-
3
-
4
-
5
-
6
-
7
-
8
-
9
-
10
-
11
-
12
-
13
-
14
-
15
-
16
-
17
-
18
-
19
-
20
-
21
-
22
-
 23
23 -
 24
24 -
 25
25 -
 26
26 -
 27
27 -
 28
28 -
 29
29 -
 30
30 -
 31
31 -
 32
32 -
 33
33 -
 34
34 -
 35
35 -
 36
36 -
 37
37 -
 38
38 -
 39
39 -
 40
40 -
 41
41 -
 42
42 -
 43
43 -
44
-
45
-
46
-
47
-
48
-
49
-
50
-
51
-
52
-
53
-
54
-
55
-
56
-
57
-
58
-
59
-
60
-
61
-
62
-
63
-
64
-
65
-
66
-
67
-
68
-
69
-
70
-
71
-
72
-
73
-
74
-
75
-
76
-
77
-
78
-
79
-
80
-
81
-
82
-
83
-
84
-
85
-
86
 |
 |

37
Introduction and Overview
The following Management’s Discussion and Analysis
(“MD&A”), should be read in conjunction with the Consolidated
Financial Statements on pages 57 through 60 (“Financial
Statements”) and the Cautionary Statements on page 52.
Throughout the MD&A, YUM! Brands, Inc. (“YUM” or the “Com-
pany”) makes reference to certain performance measures as
described below.
The Company provides the percentage changes excluding
the impact of foreign currency translation. These amounts
are derived by translating current year results at prior year
average exchange rates. We also provide the percent-
age changes excluding the extra week that certain of our
businesses had in fiscal year 2005. We believe the elimi-
nation of the foreign currency translation and the 53rd
week impact provides better year-to-year comparability
without the distortion of foreign currency fluctuations or
an extra week in fiscal year 2005.
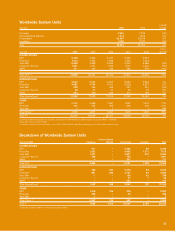
System sales growth includes the results of all restau-
rants regardless of ownership,including Company-owned,
franchise, unconsolidated affiliate and license restau-
rants. Sales of franchise, unconsolidated affiliate and
license restaurants generate franchise and license fees
for the Company (typically at a rate of 4% to 6% of sales).
Franchise,unconsolidated affiliate and license restaurant
sales are not included in Company sales on the Consoli-
dated Statements of Income; however, the franchise and
license fees are included in the Company’s revenues.
We believe system sales growth is useful to investors
as a significant indicator of the overall strength of our
business as it incorporates all of our revenue drivers,
Company and franchise same store sales as well as net
unit development.
Worldwide same store sales is the estimated growth in
sales of all restaurants that have been open one year
or more. U.S. Company same store sales include only
KFC, Pizza Hut and Taco Bell Company owned restaurants
that have been open one year or more. U.S. same store
sales for Long John Silver’s and A&W restaurants are not
included given the relative insignificance of the Company
stores for these brands and the limited impact they cur-
rently have, and will have in the future, on our U.S. same
store sales as well as our overall U.S. performance.
Company restaurant margin as a percentage of sales
is defined as Company sales less expenses incurred
directly by our Company restaurants in generating Com-
pany sales divided by Company sales.
All Note references herein refer to the Notes to the Finan-
cial Statements on pages 61 through 84. Tabular amounts
are displayed in millions except per share and unit count
amounts, or as otherwise specifically identified. All per share
and share amounts herein, and in the accompanying Finan-
cial Statements and Notes to the Financial Statements have
been adjusted to reflect the June 26, 2007 stock split (see
Note 3).
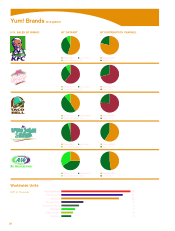
DESCRIPTION OF BUSINESS YUM is the world’s largest res-
taurant company in terms of system restaurants with over
35,000 restaurants in more than 100 countries and terri-
tories operating under the KFC, Pizza Hut, Taco Bell, Long
John Silver’s or A&W All-American Food Restaurants brands.
Four of the Company’s restaurant brands —KFC, Pizza Hut,
Taco Bell and Long John Silver’s— are the global leaders in
the chicken, pizza, Mexican-style food and quick-service sea-
food categories, respectively. Of the over 35,000 restaurants,
22% are operated by the Company, 72% are operated by fran-
chisees and unconsolidated affiliates and 6% are operated
by licensees.
YUM’s business consists of three reporting segments:
United States, the International Division and the China Divi-
sion. The China Division includes mainland China, Thailand
and KFC Taiwan and the International Division includes the
remainder of our international operations. The China and Inter-
national Divisions have been experiencing dramatic growth
and now represent over half of the Company’s operating
profits. The U.S. business operates in a highly competitive
marketplace resulting in slower profit growth, but continues
to produce strong cash flows.
STRATEGIES The Company continues to focus on four key
strategies:
Build Leading Brands in China in Every Significant Category
The Company has developed the KFC and Pizza Hut brands
into the leading quick service and casual dining restaurants,
respectively, in mainland China. Additionally, the Company
owns and operates the distribution system for its restaurants
in mainland China which we believe provides a significant
competitive advantage. Given this strong competitive posi-
tion, a rapidly growing economy and a population of 1.3 billion
in mainland China, the Company is rapidly adding KFC and
Pizza Hut Casual Dining restaurants and testing the additional
restaurant concepts of Pizza Hut Home Service (pizza deliv-
ery) and East Dawning (Chinese food). Our ongoing earnings
growth model includes annual system-sales growth of 20% in
mainland China driven by at least 425 new restaurants each
year, which we expect to drive annual operating profit growth
of 20% in the China Division.
Drive Aggressive International Expansion and Build Strong
Brands Everywhere The Company and its franchisees
opened over 850 new restaurants in 2007 in the Company’s
International Division,representing 8 straight years of opening
over 700 restaurants. The International Division generated
$480 million in operating profit in 2007 up from $186 mil-
lion in 1998. The Company expects to continue to experience
strong growth by building out existing markets and growing
in new markets including India, France, Russia, Vietnam and
Africa. Our ongoing earnings growth model includes annual
operating profit growth of 10% driven by 750 new restaurant
openings annually for the International Division. New unit
development is expected to contribute to system sales growth
of at least 5% (3% to 4% unit growth and 2% to 3% same store
sales growth) each year.
Management’s Discussion and Analysis of
Financial Condition and Results of Operations.