Pizza Hut 2007 Annual Report Download - page 37
Download and view the complete annual report
Please find page 37 of the 2007 Pizza Hut annual report below. You can navigate through the pages in the report by either clicking on the pages listed below, or by using the keyword search tool below to find specific information within the annual report.-
 1
1 -
2
-
3
-
4
-
5
-
6
-
7
-
8
-
9
-
10
-
11
-
12
-
13
-
14
-
15
-
16
-
17
-
18
-
19
-
20
-
21
-
22
-
23
-
24
-
25
-
26
-
 27
27 -
 28
28 -
 29
29 -
 30
30 -
 31
31 -
 32
32 -
 33
33 -
 34
34 -
 35
35 -
 36
36 -
 37
37 -
 38
38 -
 39
39 -
 40
40 -
 41
41 -
 42
42 -
 43
43 -
 44
44 -
 45
45 -
 46
46 -
 47
47 -
48
-
49
-
50
-
51
-
52
-
53
-
54
-
55
-
56
-
57
-
58
-
59
-
60
-
61
-
62
-
63
-
64
-
65
-
66
-
67
-
68
-
69
-
70
-
71
-
72
-
73
-
74
-
75
-
76
-
77
-
78
-
79
-
80
-
81
-
82
-
83
-
84
-
85
-
86
 |
 |

41
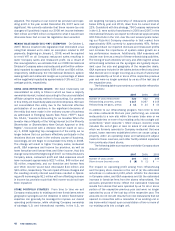
The following table summarizes the estimated historical
results of refranchising and Company store closures:
Inter-
national China
2007 U.S. Division Division Worldwide
Decreased Company sales $ (449) $ (181) $ (34) $ (664)
Increased franchise and
license fees 20 9 — 29
Decrease in total revenues $ (429) $ (172) $ (34) $ (635)
Inter-
national China
2006 U.S. Division Division Worldwide
Decreased Company sales $ (377) $ (136) $ (22) $ (535)
Increased franchise and
license fees 14 6 — 20
Decrease in total revenues $ (363) $ (130) $ (22) $ (515)
The following table summarizes the estimated impact on oper-
ating profit of refranchising and Company store closures:
Inter-
national China
2007 U.S. Division Division Worldwide
Decreased restaurant profit $ (39) $ (7) $ (4) $ (50)
Increased franchise and
license fees 20 9 — 29
Decreased general and
administrative expenses 7 3 — 10
Increase (decrease) in
operating profit $ (12) $ 5 $ (4) $ (11)
Inter-
national China
2006 U.S. Division Division Worldwide
Decreased restaurant profit $ (38) $ (5) $ — $ (43)
Increased franchise and
license fees 14 6 — 20
Decreased general and
administrative expenses 1 1 — 2
Increase (decrease) in
operating profit $ (23) $ 2 $ — $ (21)
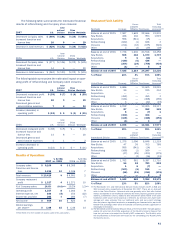
Results of Operations
% B/(W) % B/(W)
2007 vs. 2006 2006 vs. 2005
Company sales $ 9,100 9 $ 8,365 2
Franchise and license
fees 1,316 10 1,196 7
Total revenues $ 10,416 9 $ 9,561 2
Company restaurant
profit $ 1,327 4 $ 1,271 10
% of Company sales 14.6% (0.6)ppts. 15.2% 1.2ppts.
Operating profit 1,357 8 1,262 9
Interest expense, net 166 (8) 154 (22)
Income tax provision 282 1 284 (7)
Net income $ 909 10 $ 824 8
Diluted earnings
per share(a) $ 1.68 15 $ 1.46 14
(a) See Note 4 for the number of shares used in this calculation.
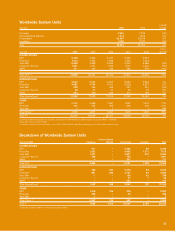
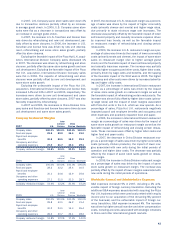
Restaurant Unit Activity
Uncon- Total
solidated Excluding
Worldwide Company Affiliates Franchisees Licensees(a)(b)
Balance at end of 2005 7,587 1,648 22,666 31,901
New Builds 426 136 953 1,515
Acquisitions 556 (541) (15) —
Refranchising (622) (1) 626 3
Closures (214) (33) (675) (922)
Other 3 (3) (39) (39)
Balance at end of 2006 7,736 1,206 23,516 32,458
New Builds 505 132 1,070 1,707
Acquisitions 9 6 (14) 1
Refranchising (420) (6) 426 —
Closures (204) (24) (706) (934)
Other (1) — 5 4
Balance at end of 2007 7,625 1,314 24,297 33,236
% of Total 23% 4% 73% 100%
Uncon- Total
solidated Excluding
United States Company Affiliates Franchisees Licensees(a)
Balance at end of 2005 4,686 — 13,605 18,291
New Builds 99 — 235 334
Acquisitions — — — —
Refranchising (452) — 455 3
Closures (124) — (368) (492)
Other 3 — (22) (19)
Balance at end of 2006 4,212 — 13,905 18,117
New Builds 87 — 262 349
Acquisitions 8 — (7) 1
Refranchising (304) — 304 —
Closures (106) — (386) (492)
Other (1) — 3 2
Balance at end of 2007 3,896 — 14,081 17,977
% of Total 22% — 78% 100%
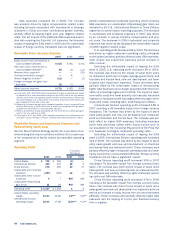
Uncon- Total
solidated Excluding
International Division Company Affiliates Franchisees Licensees(a)(b)
Balance at end of 2005 1,375 1,096 8,848 11,319
New Builds 47 35 703 785
Acquisitions 555 (541) (14) —
Refranchising (168) (1) 169 —
Closures (47) (25) (303) (375)
Other — (3) (16) (19)
Balance at end of 2006 1,762 561 9,387 11,710
New Builds 54 18 780 852
Acquisitions 1 6 (7) —
Refranchising (109) (6) 115 —
Closures (66) (11) (314) (391)
Other — — 2 2
Balance at end of 2007 1,642 568 9,963 12,173
% of Total 13% 5% 82% 100%
(a) The Worldwide, U.S. and International Division totals exclude 2,109, 1,928 and
181 licensed units, respectively, at December 29, 2007. There are no licensed
units in the China Division. Licensed units are generally units that offer limited
menus and operate in non-traditional locations like malls, airports, gasoline service
stations, convenience stores, stadiums and amusement parks where a full scale
traditional outlet would not be practical or efficient. As licensed units have lower
average unit sales volumes than our traditional units and our current strategy
does not place a significant emphasis on expanding our licensed units, we do not
believe that providing further detail of licensed unit activity provides significant or
meaningful information.
(b) The Worldwide and International Division totals at the end of 2007 exclude approxi-
mately 32 units from the 2006 acquisition of the Rostik’s brand in Russia that
have not yet been co-branded into Rostik’s/KFC restaurants. The Rostik’s units
will be presented as franchisee new builds as the co-branding into Rostik’s/KFC
restaurants occurs.