Pizza Hut 2007 Annual Report Download - page 36
Download and view the complete annual report
Please find page 36 of the 2007 Pizza Hut annual report below. You can navigate through the pages in the report by either clicking on the pages listed below, or by using the keyword search tool below to find specific information within the annual report.-
 1
1 -
2
-
3
-
4
-
5
-
6
-
7
-
8
-
9
-
10
-
11
-
12
-
13
-
14
-
15
-
16
-
17
-
18
-
19
-
20
-
21
-
22
-
23
-
24
-
25
-
 26
26 -
 27
27 -
 28
28 -
 29
29 -
 30
30 -
 31
31 -
 32
32 -
 33
33 -
 34
34 -
 35
35 -
 36
36 -
 37
37 -
 38
38 -
 39
39 -
 40
40 -
 41
41 -
 42
42 -
 43
43 -
 44
44 -
 45
45 -
 46
46 -
47
-
48
-
49
-
50
-
51
-
52
-
53
-
54
-
55
-
56
-
57
-
58
-
59
-
60
-
61
-
62
-
63
-
64
-
65
-
66
-
67
-
68
-
69
-
70
-
71
-
72
-
73
-
74
-
75
-
76
-
77
-
78
-
79
-
80
-
81
-
82
-
83
-
84
-
85
-
86
 |
 |

40 YUM! BRANDS, INC.
adjusted. The impacts on our income tax provision and oper-
ating profit in the year ended December 29, 2007 were not
significant. We currently estimate that these income tax rate
changes will positively impact our 2008 net income between
$10 million and $15 million compared to what it would have
otherwise been had no new tax legislation been enacted.
MEXICO VALUE ADDED TAX (“VAT”) EXEMPTION On October 1,
2007, Mexico enacted new legislation that eliminated a tax
ruling that allowed us to claim an exemption related to VAT
payments. Beginning on January 1, 2008, we will be required
to remit VAT on all Company restaurant sales resulting in
lower Company sales and restaurant profit. As a result of
this new legislation, we estimate that our 2008 International
Division’s Company sales and restaurant profit will be unfavor-
ably impacted by approximately $38 million and $34 million,
respectively. Additionally, the International Division’s system
sales growth and restaurant margin as a percentage of sales
will be negatively impacted by approximately 0.3% and 1.2 per-
centage points, respectively.
CHINA 2008 REPORTING ISSUES We have historically not
consolidated an entity in China in which we have a majority
ownership interest, instead accounting for the unconsolidated
affiliate using the equity method of accounting. Our partners
in this entity are essentially state-owned enterprises. We have
not consolidated this entity due to the historical effective
participation of our partners in the significant decisions of
the entity that were made in the ordinary course of business
as addressed in Emerging Issues Task Force (“EITF”) Issue
No. 96-16, “Investor’s Accounting for an Investee When the
Investor Has a Majority of the Voting Interest but the Minority
Shareholder or Shareholders Have Certain Approval or Veto
Rights”. Concurrent with a decision that we made on Janu-
ary 1, 2008 regarding top management of the entity, we no
longer believe that our partners effectively participate in the
decisions that are made in the ordinary course of business.
Accordingly, we will begin to consolidate this entity in 2008.
The change will result in higher Company sales, restaurant
profit, G&A expenses and Income tax provision, as well as
lower franchise and license fees and Other income. Had this
change occurred at the beginning of 2007, our China Division’s
Company sales, restaurant profit and G&A expenses would
have increased approximately $227 million, $49 million and
$5 million, respectively, and our franchise and license fees
and Other income would have decreased $14 million and
$13 million, respectively. The net impact of these changes and
the resulting minority interest would have resulted in Operat-
ing profit increasing by $11 million with an offsetting increase
in Income tax provision such that Net income would not have
been impacted.
STORE PORTFOLIO STRATEGY From time to time we sell
Company restaurants to existing and new franchisees where
geographic synergies can be obtained or where franchisees’
expertise can generally be leveraged to improve our overall
operating performance, while retaining Company ownership
of strategic U.S. and international markets. In the U.S., we
are targeting Company ownership of restaurants potentially
below 10% by year end 2010, down from its current level of
22%. Consistent with this strategy, 756 Company restaurants
in the U.S. were sold to franchisees in 2006 and 2007. In the
International Division, we expect to refranchise approximately
300 Pizza Huts in the U.K. over the next several years reduc-
ing our Pizza Hut Company ownership in that market from
approximately 80% currently to approximately 40%. Refran-
chisings reduce our reported revenues and restaurant profits
and increase the importance of system sales growth as a
key performance measure. Additionally, G&A expenses will
decline over time as a result of these refranchising activities.
The timing of such declines will vary and often lag the actual
refranchising activities as the synergies are typically depen-
dent upon the size and geography of the respective deals.
G&A expenses included in the tables below reflect only direct
G&A that we are no longer incurring as a result of stores that
were operated by us for all or some of the respective previous
year and were no longer operated by us as of the last day of
the respective year.
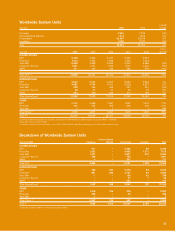
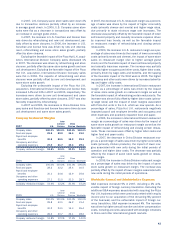
The following table summarizes our worldwide refranchis-
ing activities:
2007 2006 2005
Number of units refranchised 420 622 382
Refranchising proceeds, pre-tax $ 117 $ 257 $ 145
Refranchising net gains, pre-tax $ 11 $ 24 $ 43
In addition to our refranchising program, from time to time
we close restaurants that are poor performing, we relocate
restaurants to a new site within the same trade area or we
consolidate two or more of our existing units into a single unit
(collectively “store closures”). Store closure (income) costs
includes the net of gain or loss on sales of real estate on
which we formerly operated a Company restaurant that was
closed, lease reserves established when we cease using a
property under an operating lease and subsequent adjust-
ments to those reserves, and other facility-related expenses
from previously closed stores.
The following table summarizes worldwide Company store
closure activities:
2007 2006 2005
Number of units closed 204 214 246
Store closure (income) costs $ (8) $ (1) $ —
The impact on operating profit arising from refranchising
and Company store closures is the net of (a) the estimated
reductions in restaurant profit, which reflects the decrease
in Company sales, and G&A expenses and (b) the estimated
increase in franchise fees from the stores refranchised. The
amounts presented below reflect the estimated historical
results from stores that were operated by us for all or some
portion of the respective previous year and were no longer
operated by us as of the last day of the respective year. The
amounts do not include results from new restaurants that we
opened in connection with a relocation of an existing unit or
any incremental impact upon consolidation of two or more of
our existing units into a single unit.