Panera Bread 2010 Annual Report Download - page 83
Download and view the complete annual report
Please find page 83 of the 2010 Panera Bread annual report below. You can navigate through the pages in the report by either clicking on the pages listed below, or by using the keyword search tool below to find specific information within the annual report.-
 1
1 -
2
-
3
-
4
-
5
-
6
-
7
-
8
-
9
-
10
-
11
-
12
-
13
-
14
-
15
-
16
-
17
-
18
-
19
-
20
-
21
-
22
-
23
-
24
-
25
-
26
-
27
-
28
-
29
-
30
-
31
-
32
-
33
-
34
-
35
-
36
-
37
-
38
-
39
-
40
-
41
-
42
-
43
-
44
-
45
-
46
-
47
-
48
-
49
-
50
-
51
-
52
-
53
-
54
-
55
-
56
-
57
-
58
-
59
-
60
-
61
-
62
-
63
-
64
-
65
-
66
-
67
-
68
-
69
-
70
-
71
-
72
-
 73
73 -
 74
74 -
 75
75 -
 76
76 -
 77
77 -
 78
78 -
 79
79 -
 80
80 -
 81
81 -
 82
82 -
 83
83 -
 84
84 -
 85
85 -
 86
86 -
 87
87 -
 88
88 -
 89
89 -
 90
90 -
 91
91 -
 92
92 -
 93
93 -
94
-
95
-
96
-
97
-
98
 |
 |

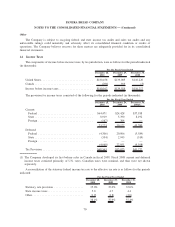
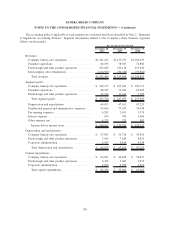
The following table summarizes the Company’s stock option activity under its stock-based compensation
plans during fiscal 2010, fiscal 2009, and fiscal 2008:
Shares
(in thousands)
Weighted
Average
Exercise Price
Weighted Average
Contractual Term
Remaining
(years)
Aggregate
Intrinsic
Value(1)
(in thousands)
Outstanding at December 25, 2007 ......... 2,086 $39.05
Granted........................... 127 45.06
Exercised .......................... (532) 33.03 $ 8,293
Cancelled.......................... (229) 45.68
Outstanding at December 30, 2008 ......... 1,452 $40.73
Granted........................... 7 52.23
Exercised .......................... (627) 36.39 13,115
Cancelled.......................... (18) 46.91
Outstanding at December 29, 2009 ......... 814 $44.04
Granted........................... 4 67.94
Exercised .......................... (598) 42.68 20,867
Cancelled.......................... (4) 49.63
Outstanding at December 28, 2010 ......... 216 $48.17 2.6 11,662
Exercisable at December 28, 2010 ......... 83 $51.66 2.3 $ 4,206
(1) Intrinsic value for activities other than exercises is defined as the difference between the grant price and the
market value on the last day of fiscal 2010 of $102.11 for those stock options where the market value is greater
than the exercise price. For exercises, intrinsic value is defined as the difference between the grant price and the
market value on the date of exercise.
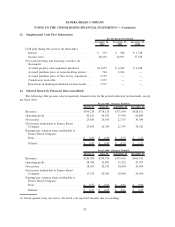
Cash received from the exercise of stock options in fiscal 2010, fiscal 2009, and fiscal 2008 was $25.6 million,
$22.8 million, and $17.6 million respectively. Windfall tax benefits realized from exercised stock options in fiscal
2010, fiscal 2009, and fiscal 2008 were $3.6 million, $5.1 million, and $3.4 million, respectively, and were included
as cash inflows from financing activities in the Consolidated Statements of Cash Flows.
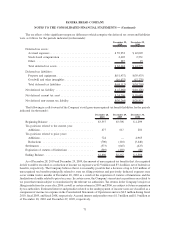
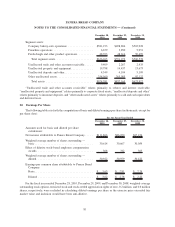
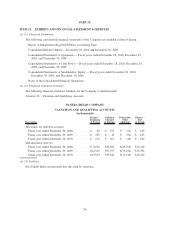
The following table summarizes information about stock options outstanding at December 28, 2010:
Range of Exercise Price
Number
Outstanding
(in thousands)
Weighted Average
Contractual Term
Remaining
(years)
Weighted
Average
Exercise Price
Number
Exercisable
(in thousands)
Weighted
Average
Exercise Price
Stock Options Outstanding
Stock Options Exercisable
$36.57 - $40.35 ........... 15 3.1 $37.66 11 $36.70
$40.36 - $44.41 ........... 88 2.8 43.14 15 43.18
$44.42 - $48.02 ........... 33 1.7 47.95 13 47.95
$48.03 - $52.24 ........... 51 3.4 50.93 17 51.11
$52.25 - $60.07 ........... 12 1.5 56.23 10 55.70
$60.08 - $72.58 ........... 17 2.0 69.41 17 69.44
216 2.6 $48.17 83 $51.66
76
PANERA BREAD COMPANY
NOTES TO THE CONSOLIDATED FINANCIAL STATEMENTS — (Continued)