Panera Bread 2010 Annual Report Download - page 37
Download and view the complete annual report
Please find page 37 of the 2010 Panera Bread annual report below. You can navigate through the pages in the report by either clicking on the pages listed below, or by using the keyword search tool below to find specific information within the annual report.-
 1
1 -
2
-
3
-
4
-
5
-
6
-
7
-
8
-
9
-
10
-
11
-
12
-
13
-
14
-
15
-
16
-
17
-
18
-
19
-
20
-
21
-
22
-
23
-
24
-
25
-
26
-
 27
27 -
 28
28 -
 29
29 -
 30
30 -
 31
31 -
 32
32 -
 33
33 -
 34
34 -
 35
35 -
 36
36 -
 37
37 -
 38
38 -
 39
39 -
 40
40 -
 41
41 -
 42
42 -
 43
43 -
 44
44 -
 45
45 -
 46
46 -
 47
47 -
48
-
49
-
50
-
51
-
52
-
53
-
54
-
55
-
56
-
57
-
58
-
59
-
60
-
61
-
62
-
63
-
64
-
65
-
66
-
67
-
68
-
69
-
70
-
71
-
72
-
73
-
74
-
75
-
76
-
77
-
78
-
79
-
80
-
81
-
82
-
83
-
84
-
85
-
86
-
87
-
88
-
89
-
90
-
91
-
92
-
93
-
94
-
95
-
96
-
97
-
98
 |
 |
prior fiscal year, the 8.2 percent increase in franchise-operated comparable net bakery-cafe sales, and increased
produce distribution sales.
Costs and Expenses
The cost of food and paper products includes the costs associated with the fresh dough and other product
operations that sell fresh dough and other products to Company-owned bakery-cafes, as well as the cost of food and
paper products supplied by third-party vendors and distributors. The costs associated with the fresh dough and other
product operations that sell fresh dough and other products to the franchise-operated bakery-cafes are excluded
from the cost of food and paper products and are shown separately as fresh dough and other product cost of sales to
franchisees in the Consolidated Statements of Operations.
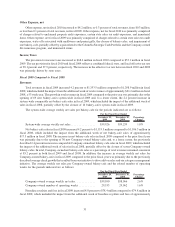
The cost of food and paper products was $374.8 million, or 28.4 percent of net bakery-cafe sales in fiscal 2010,
compared to $337.6 million, or 29.3 percent of net bakery-cafe sales, in fiscal 2009. This decrease in the cost of food
and paper products as a percentage of net bakery-cafe sales was principally due to category management initiatives,
purchasing improvements, food cost deflation, improved leverage of our fresh dough manufacturing costs due to
additional bakery-cafe openings, and improved leverage overall from higher comparable net bakery-cafe sales,
partially offset by costs incurred related to the roll-out of our MyPanera loyalty program. In fiscal 2010, there was an
average of 65.2 bakery-cafes per fresh dough facility compared to an average of 62.5 in fiscal 2009.
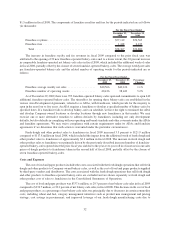
Labor expense was $419.1 million, or 31.7 percent of net bakery-cafe sales, in fiscal 2010 compared to
$370.6 million, or 32.1 percent of net bakery-cafe sales, in fiscal 2009. The decrease in labor expense as a
percentage of net bakery-cafe sales was primarily a result of improved leverage from higher comparable net bakery-
cafe sales and lower costs due to the timing of lower than normal self-insurance claims, partially offset by the
increased labor investment related to the rollout of our MyPanera loyalty program.
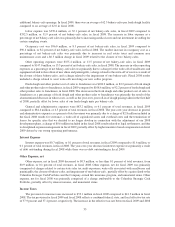
Occupancy cost was $101.0 million, or 7.6 percent of net bakery-cafe sales, in fiscal 2010 compared to
$96.0 million, or 8.3 percent of net bakery-cafe sales, in fiscal 2009. The decrease in occupancy cost as a percentage
of net bakery-cafe sales was primarily a result of common area maintenance credits received in 2010, as landlords
spent less on common area maintenance in prior years than anticipated, improved leverage from higher comparable
net bakery-cafe sales, and lower occupancy costs in new bakery-cafes.
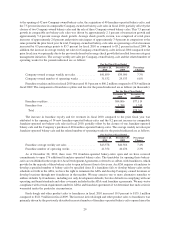
Other operating expenses were $177.1 million, or 13.4 percent of net bakery-cafe sales, in fiscal 2010
compared to $155.4 million, or 13.5 percent of net bakery-cafe sales, in fiscal 2009. The decrease in other operating
expenses as a percentage of net bakery-cafe sales was primarily a result of improved leverage from higher
comparable net bakery-cafe sales, partially offset by costs associated with the roll-out of our MyPanera loyalty
program.
Fresh dough and other product cost of sales to franchisees was $111.0 million, or 82.1 percent of fresh dough
and other product sales to franchisees, in fiscal 2010 compared to $100.2 million, or 82.2 percent of fresh dough and
other product sales to franchisees, in fiscal 2009. The decrease in the fresh dough and other product cost of sales to
franchisees as a percentage of fresh dough and other product sales to franchisees was primarily the result of the
year-over-year decrease in ingredient costs, improved leverage from new bakery-cafes, higher comparable net
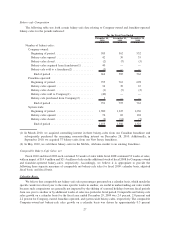
bakery-cafe sales, and the Company’s purchase of 40 franchise-operated bakery-cafes.
General and administrative expenses were $101.5 million, or 6.6 percent of total revenues, in fiscal 2010
compared to $83.2 million, or 6.1 percent of total revenues, in fiscal 2009. The increase in general and
administrative expenses as a percent of total revenues was primarily the result of investments made in our
marketing infrastructure and higher incentive compensation expense compared to the prior year driven by our fiscal
2010 performance exceeding original targets, partially offset by improved leverage from increased revenues.
Interest Expense
Interest expense was $0.7 million, or less than 0.1 percent of total revenues, in fiscal 2010 compared to
$0.7 million, or 0.1 percent of total revenues, in fiscal 2009. The year-over-year decrease in interest expense as a
percentage of total revenues was the result of increased revenues.
30