Panera Bread 2010 Annual Report Download - page 32
Download and view the complete annual report
Please find page 32 of the 2010 Panera Bread annual report below. You can navigate through the pages in the report by either clicking on the pages listed below, or by using the keyword search tool below to find specific information within the annual report.-
 1
1 -
2
-
3
-
4
-
5
-
6
-
7
-
8
-
9
-
10
-
11
-
12
-
13
-
14
-
15
-
16
-
17
-
18
-
19
-
20
-
21
-
 22
22 -
 23
23 -
 24
24 -
 25
25 -
 26
26 -
 27
27 -
 28
28 -
 29
29 -
 30
30 -
 31
31 -
 32
32 -
 33
33 -
 34
34 -
 35
35 -
 36
36 -
 37
37 -
 38
38 -
 39
39 -
 40
40 -
 41
41 -
 42
42 -
43
-
44
-
45
-
46
-
47
-
48
-
49
-
50
-
51
-
52
-
53
-
54
-
55
-
56
-
57
-
58
-
59
-
60
-
61
-
62
-
63
-
64
-
65
-
66
-
67
-
68
-
69
-
70
-
71
-
72
-
73
-
74
-
75
-
76
-
77
-
78
-
79
-
80
-
81
-
82
-
83
-
84
-
85
-
86
-
87
-
88
-
89
-
90
-
91
-
92
-
93
-
94
-
95
-
96
-
97
-
98
 |
 |
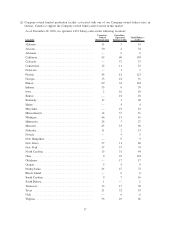
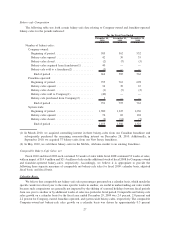
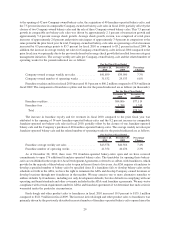
number of bakery-cafes in the “honeymoon” phase, the number of bakery-cafes in the “settle-in” phase, and the
number of bakery-cafes in the comparable bakery-cafe base.
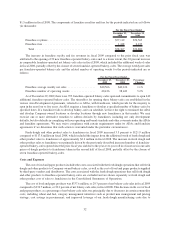
Executive Summary of Results
In fiscal 2010, we earned $3.62 per diluted share with the following performance on key metrics: system-wide
comparable net bakery-cafe sales growth of 7.9 percent (growth of 7.5 percent for Company-owned bakery-cafes
and growth of 8.2 percent for franchise-operated bakery-cafes); system-wide average weekly net sales increased
7.3 percent to $42,852 ($41,899 for Company-owned bakery-cafes and $43,578 for franchise-operated bakery-
cafes); 76 new bakery-cafes opened system-wide (42 Company-owned bakery-cafes and 34 franchise-operated
bakery-cafes); and three bakery-cafes closed system-wide (two Company-owned bakery-cafes and one franchise-
operated bakery-cafes). Our fiscal 2010 results of $3.62 per diluted share included a favorable impact of $0.10 per
diluted share from the repurchase of 1,905,540 shares under our $600.0 million share repurchase authorization.
In the fiscal quarter ended December 28, 2010, we earned $1.21 per diluted share with the following
performance on key metrics: system-wide comparable net bakery-cafe sales growth of 5.8 percent (growth of
5.2 percent for Company-owned bakery-cafes and growth of 6.1 percent for franchise-operated bakery-cafes);
system-wide average weekly net sales increased 5.1 percent to $44,727 ($44,034 for Company-owned bakery-cafes
and $45,301 for franchise-operated bakery-cafes); 33 new bakery-cafes opened system-wide (21 Company-owned
bakery-cafes and 12 franchise-operated bakery-cafes); and one Company-owned bakery-cafe closed .
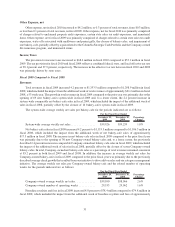
In fiscal 2009, we earned $2.78 per diluted share with the following performance on key metrics: system-wide
comparable net bakery-cafe sales growth of 2.2 percent (growth of 2.4 percent for Company-owned bakery-cafes
and growth of 2.0 percent for franchise-operated bakery-cafes), which included the impact of the additional week in
fiscal 2008, a 53 week year; system-wide average weekly net sales increased 1.8 percent to $39,926 ($39,050 for
Company-owned bakery-cafes and $40,566 for franchise-operated bakery-cafes); 69 new bakery-cafes opened
system-wide (30 Company-owned bakery-cafes and 39 franchise-operated bakery-cafes); and 14 bakery-cafes
closed system-wide (seven Company-owned bakery-cafes and seven franchise-operated bakery-cafes). Our fiscal
2009 results of $2.78 per diluted share included $0.13 per diluted share of net charges, including a $0.07 per diluted
share charge to increase reserves for certain state sales tax audit exposures, a charge of $0.04 per diluted share to
write-off smallwares and equipment related to the rollout of new china and panini grills, a charge of $0.04 per
diluted share related to the closure of bakery-cafes, and a charge of $0.01 per diluted share related to the impairment
of one bakery-cafe, partially offset by a $0.03 per diluted share gain recorded on both the redemptions received
during year on our investment in the Columbia Strategic Cash Portfolio and the change in the recorded fair value of
the units held during the year.
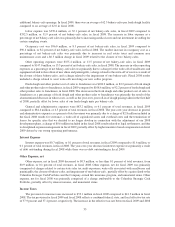
In fiscal 2008, we earned $2.22 per diluted share with the following performance on key metrics: system-wide
comparable net bakery-cafe sales growth of 3.6 percent (growth of 3.8 percent for Company-owned bakery-cafes
and growth of 3.5 percent for franchise-operated bakery-cafes), which included the impact of the additional week in
fiscal 2008, a 53 week year; system-wide average weekly net sales increased 1.5 percent to $39,239 ($38,066 for
Company-owned bakery-cafes and $40,126 for franchise-operated bakery-cafes); 102 new bakery-cafes opened
system-wide (35 Company-owned bakery-cafes and 67 franchise-operated bakery-cafes); and seven bakery-cafes
closed system-wide (five Company-owned bakery-cafes and two franchise-operated bakery-cafes). In addition,
beginning in the first quarter of fiscal 2008, we adjusted our 2008 development plans and made a determination to
raise our sales hurdles for new bakery-cafe development and to no longer develop specific sites. As a result of this
determination, we established a reserve and recorded a charge of $2.8 million, or $0.06 per diluted share, to general
and administrative expenses related to severance, the write-off of capitalized assets and overhead costs and the
termination of leases for specific sites that we decided to no longer develop. Our fiscal 2008 results of $2.22 per
diluted share also included additional charges totaling $0.08 per diluted share, including a write-down of our
investment in the Columbia Strategic Cash Portfolio of $0.04 per diluted share, a $0.01 per diluted share impact
with respect to on-going legal settlements, a $0.02 per diluted share impact of an unfavorable tax adjustment, and a
charge of $0.01 per diluted share for asset write-offs related to our new coffee program.
25