Panera Bread 2010 Annual Report Download - page 42
Download and view the complete annual report
Please find page 42 of the 2010 Panera Bread annual report below. You can navigate through the pages in the report by either clicking on the pages listed below, or by using the keyword search tool below to find specific information within the annual report.-
 1
1 -
2
-
3
-
4
-
5
-
6
-
7
-
8
-
9
-
10
-
11
-
12
-
13
-
14
-
15
-
16
-
17
-
18
-
19
-
20
-
21
-
22
-
23
-
24
-
25
-
26
-
27
-
28
-
29
-
30
-
31
-
 32
32 -
 33
33 -
 34
34 -
 35
35 -
 36
36 -
 37
37 -
 38
38 -
 39
39 -
 40
40 -
 41
41 -
 42
42 -
 43
43 -
 44
44 -
 45
45 -
 46
46 -
 47
47 -
 48
48 -
 49
49 -
 50
50 -
 51
51 -
 52
52 -
53
-
54
-
55
-
56
-
57
-
58
-
59
-
60
-
61
-
62
-
63
-
64
-
65
-
66
-
67
-
68
-
69
-
70
-
71
-
72
-
73
-
74
-
75
-
76
-
77
-
78
-
79
-
80
-
81
-
82
-
83
-
84
-
85
-
86
-
87
-
88
-
89
-
90
-
91
-
92
-
93
-
94
-
95
-
96
-
97
-
98
 |
 |

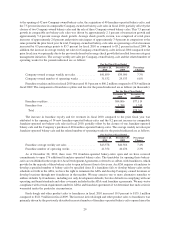
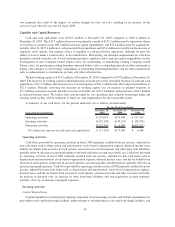
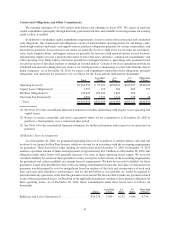
other capital needs. A summary of capital expenditures for the periods indicated consisted of the following (in
thousands):
December 28,
2010
December 29,
2009
December 30,
2008
For the Fiscal Year Ended
New bakery-cafe and fresh dough facilities .......... $42,294 $28,036 $39,122
Bakery-cafe and fresh dough facility improvements .... 27,009 21,695 20,665
Other capital needs ............................ 12,923 4,953 3,376
Total..................................... $82,226 $54,684 $63,163
Our capital requirements, including development costs related to the opening or acquisition of additional
bakery-cafes and fresh dough facilities and maintenance and remodel expenditures, have been and will continue to
be significant. Our future capital requirements and the adequacy of available funds will depend on many factors,
including the pace of expansion, real estate markets, site locations, and the nature of the arrangements negotiated
with landlords. We believe that cash provided by our operations and available borrowings under our existing credit
facility will be sufficient to fund our capital requirements in both our short-term and long-term future. We currently
anticipate 95 to 105 system-wide bakery-cafe openings in fiscal 2011. We expect future bakery-cafes will require,
on average, an investment per bakery-cafe (excluding pre-opening expenses which are expensed as incurred) of
approximately $750,000, which is net of landlord allowances and excludes capitalized development overhead.
Business Combinations
We used approximately $52.2 million and $2.7 million of cash flows for acquisitions, in fiscal 2010 and fiscal
2008, respectively. In fiscal 2009 there were no acquisitions. In fiscal 2010, we purchased a controlling interest in
certain assets, liabilities, and the operations of three bakery-cafes in Ontario, Canada from our Canadian franchisee
in a non-cash transaction. We subsequently purchased the remaining noncontrolling interest in the three bakery-
cafes on December 28, 2010 for $0.7 million. Additionally, in fiscal 2010 we purchased substantially all the assets
and certain liabilities of 37 bakery-cafes from our New Jersey franchisee. In fiscal 2008, we made required
payments of the remaining acquisition purchase price of $2.5 million, including accrued interest, for certain
acquisitions completed in the first half of fiscal 2007, and we paid an additional purchase price of $0.2 million
related to the settlement of certain purchase price adjustments for the first quarter of fiscal 2007 acquisition of
Paradise Bakery & Café, Inc., or Paradise. Within our Consolidated Balance Sheets as of December 28, 2010 and
December 29, 2009, $5.0 million and $2.3 million respectively, were included for contingent or accrued purchase
price remaining from previously completed acquisitions. As of December 30, 2008, we had no contingent or
accrued purchase price remaining from previously completed acquisitions. See Note 3 to the consolidated financial
statements for further information with respect to our acquisition activity in fiscal 2010 and fiscal 2008.
Investments
Historically, we invested a portion of our cash balances on hand in a private placement of units of beneficial
interest in the Columbia Strategic Cash Portfolio, which was an enhanced cash fund previously sold as an alternative
to traditional money-market funds. The Columbia Strategic Cash Portfolio included investments in certain asset-
backed securities and structured investment vehicles that were collateralized by sub-prime mortgage securities or
related to mortgage securities, among other assets. As a result of adverse market conditions that unfavorably
affected the fair value and liquidity availability of collateral underlying the Columbia Strategic Cash Portfolio, it
was overwhelmed with withdrawal requests from investors and the Columbia Strategic Cash Portfolio was closed
with a restriction placed upon the cash redemption ability of its holders in the fourth quarter of fiscal 2007.
During fiscal 2009, we received $5.5 million of cash redemptions at an average net asset value of $0.861 per
unit, which fully redeemed our remaining units in the Columbia Strategic Cash Portfolio, and we classified the
redemptions as investment maturity proceeds provided by investing activities. In total, we recognized a net realized
and unrealized gain on the Columbia Strategic Cash Portfolio units of $1.3 million in fiscal 2009 related to the fair
value measurements and redemptions received and included the net gain in net cash provided by operating
activities. The estimated fair value of the Columbia Strategic Cash Portfolio units was $0.650 per unit, or
35