Panera Bread 2010 Annual Report Download - page 23
Download and view the complete annual report
Please find page 23 of the 2010 Panera Bread annual report below. You can navigate through the pages in the report by either clicking on the pages listed below, or by using the keyword search tool below to find specific information within the annual report.-
 1
1 -
2
-
3
-
4
-
5
-
6
-
7
-
8
-
9
-
10
-
11
-
12
-
 13
13 -
 14
14 -
 15
15 -
 16
16 -
 17
17 -
 18
18 -
 19
19 -
 20
20 -
 21
21 -
 22
22 -
 23
23 -
 24
24 -
 25
25 -
 26
26 -
 27
27 -
 28
28 -
 29
29 -
 30
30 -
 31
31 -
 32
32 -
 33
33 -
34
-
35
-
36
-
37
-
38
-
39
-
40
-
41
-
42
-
43
-
44
-
45
-
46
-
47
-
48
-
49
-
50
-
51
-
52
-
53
-
54
-
55
-
56
-
57
-
58
-
59
-
60
-
61
-
62
-
63
-
64
-
65
-
66
-
67
-
68
-
69
-
70
-
71
-
72
-
73
-
74
-
75
-
76
-
77
-
78
-
79
-
80
-
81
-
82
-
83
-
84
-
85
-
86
-
87
-
88
-
89
-
90
-
91
-
92
-
93
-
94
-
95
-
96
-
97
-
98
 |
 |

Failure to meet market expectations for our financial performance will likely adversely affect the market
price of our stock.
The public trading of our stock is based in large part on market expectations that our business will continue to
grow and that we will achieve certain levels of financial performance. Should we fail to meet market expectations
going forward, particularly with respect to comparable net bakery-cafe sales revenues, operating margins, and
diluted earnings per share, the market price of our stock will likely decline.
ITEM 1B. UNRESOLVED STAFF COMMENTS
None.
ITEM 2. PROPERTIES
The average size of a Company-owned bakery-cafe as of December 28, 2010 was approximately 4,600 square
feet. The square footage of each of our fresh dough facilities is provided below. We lease all of our bakery-cafe
locations, fresh dough facilities, and support centers. Lease terms for our bakery-cafes, fresh dough facilities, and
support centers are generally 10 years with renewal options at most locations and our leases generally require us to
pay a proportionate share of real estate taxes, insurance, common area maintenance, and other operating costs.
Many bakery-cafe leases provide for contingent rental (i.e. percentage rent) payments based on sales in excess of
specified amounts or changes in external indices. Certain of our lease agreements provide for scheduled rent
increases during the lease terms or for rental payments commencing at a date other than the date of initial
occupancy. See Note 2 to the consolidated financial statements for further information on our accounting for leases.
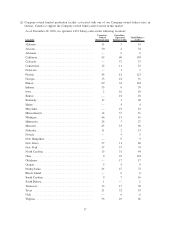
The square footage of our Company-owned leased fresh dough facilities as of December 28, 2010 is set forth
below:
Facility Square Footage
Atlanta,GA....................................................... 18,000
Beltsville, MD ..................................................... 35,700
Chicago, IL ....................................................... 30,900
Cincinnati,OH..................................................... 22,300
Dallas,TX........................................................ 12,900
Denver,CO ....................................................... 10,000
Detroit,MI........................................................ 19,600
Fairfield,NJ....................................................... 39,900
Franklin, MA(1) .................................................... 40,300
Greensboro, NC .................................................... 19,200
Houston, TX ...................................................... 20,700
Kansas City, KS .................................................... 17,000
Minneapolis, MN ................................................... 10,300
Miramar, FL ...................................................... 15,100
Ontario,CA....................................................... 27,800
Orlando, FL ....................................................... 16,500
Phoenix, AZ....................................................... 13,100
Seattle, WA ....................................................... 16,600
St. Louis, MO ..................................................... 30,000
Stockton, CA ...................................................... 15,800
Warren,OH....................................................... 16,300
Ontario, CAN(2) ................................................... 300
(1) Total square footage includes approximately 20,000 square feet utilized in tuna and cream cheese production.
16