Panera Bread 2010 Annual Report Download - page 40
Download and view the complete annual report
Please find page 40 of the 2010 Panera Bread annual report below. You can navigate through the pages in the report by either clicking on the pages listed below, or by using the keyword search tool below to find specific information within the annual report.-
 1
1 -
2
-
3
-
4
-
5
-
6
-
7
-
8
-
9
-
10
-
11
-
12
-
13
-
14
-
15
-
16
-
17
-
18
-
19
-
20
-
21
-
22
-
23
-
24
-
25
-
26
-
27
-
28
-
29
-
 30
30 -
 31
31 -
 32
32 -
 33
33 -
 34
34 -
 35
35 -
 36
36 -
 37
37 -
 38
38 -
 39
39 -
 40
40 -
 41
41 -
 42
42 -
 43
43 -
 44
44 -
 45
45 -
 46
46 -
 47
47 -
 48
48 -
 49
49 -
 50
50 -
51
-
52
-
53
-
54
-
55
-
56
-
57
-
58
-
59
-
60
-
61
-
62
-
63
-
64
-
65
-
66
-
67
-
68
-
69
-
70
-
71
-
72
-
73
-
74
-
75
-
76
-
77
-
78
-
79
-
80
-
81
-
82
-
83
-
84
-
85
-
86
-
87
-
88
-
89
-
90
-
91
-
92
-
93
-
94
-
95
-
96
-
97
-
98
 |
 |
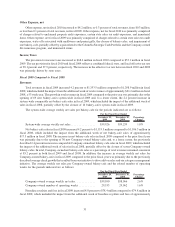
additional bakery-cafe openings. In fiscal 2009, there was an average of 62.5 bakery-cafes per fresh dough facility
compared to an average of 62.0 in fiscal 2008.
Labor expense was $370.6 million, or 32.1 percent of net bakery-cafe sales, in fiscal 2009 compared to
$352.5 million, or 31.9 percent of net bakery-cafe sales, in fiscal 2008. The increase in labor expense as a
percentage of net bakery-cafe sales was primarily due to increasing medical costs and our investment in staffing for
certain sampling events.
Occupancy cost was $96.0 million, or 8.3 percent of net bakery-cafe sales, in fiscal 2009 compared to
$90.4 million, or 8.2 percent of net bakery-cafe sales, in fiscal 2008. The modest increase in occupancy cost as a
percentage of net bakery-cafe sales was primarily due to increases in real estate taxes and common area
maintenance costs and a $0.3 million charge in fiscal 2009 related to the closure of two bakery-cafes.
Other operating expenses were $155.4 million, or 13.5 percent of net bakery-cafe sales, in fiscal 2009
compared to $147.0 million, or 13.3 percent of net bakery-cafe sales, in fiscal 2008. The increase in other operating
expenses as a percentage of net bakery-cafe sales was primarily due to a charge for the write-off of smallwares and
equipment related to the rollout of new china and panini grills, a charge related to the write-off of assets as a result of
the closure of three bakery-cafes, and a charge related to the impairment of one bakery-cafe. Fiscal 2008 results
included a charge related to asset write-offs involving our new coffee program.
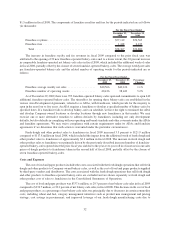
Fresh dough and other product cost of sales to franchisees was $100.2 million, or 82.2 percent of fresh dough
and other product sales to franchisees, in fiscal 2009 compared to $108.6 million, or 92.2 percent of fresh dough and
other product sales to franchisees, in fiscal 2008. The decrease in the fresh dough and other product cost of sales to
franchisees as a percentage of fresh dough and other product sales to franchisees was primarily the result of the
aforementioned decrease in wheat costs, as well as the year-over-year roll-in of dough pricing taken in the first half
of 2008, partially offset by lower sales of our fresh dough units per bakery-cafe.
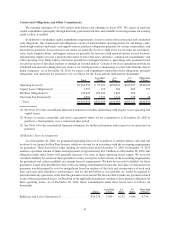
General and administrative expenses were $83.2 million, or 6.1 percent of total revenues, in fiscal 2009
compared to $84.4 million, or 6.5 percent of total revenues, in fiscal 2008. The year-over-year decrease in general
and administrative expenses as a percent of total revenues was primarily due to a charge of $2.8 million included in
the fiscal 2008 results for severance, a write-off of capitalized assets and overhead costs and the termination of
leases for specific sites that we decided to no longer develop in connection with the adjustment of our 2008
development plans, a charge of $0.6 million included in the fiscal 2008 results related to legal settlements, and due
to disciplined expense management in fiscal 2009, partially offset by higher incentive based compensation in fiscal
2009 driven by our strong operating performance.
Interest Expense
Interest expense was $0.7 million, or 0.1 percent of total revenues, in fiscal 2009 compared to $1.6 million, or
0.1 percent of total revenues, in fiscal 2008. The year-over-year decrease in interest expense was primarily a result
of debt outstanding during fiscal 2008 while there was no debt outstanding in fiscal 2009.
Other Expense, net
Other expense, net in fiscal 2009 decreased to $0.3 million, or less than 0.1 percent of total revenues, from
$0.9 million, or 0.1 percent of total revenues, in fiscal 2008. Other expense, net for fiscal 2009 was primarily
comprised of charges related to certain state sales tax audit exposures, write-offs associated with smallwares and
panini grills, the closure of bakery-cafes, and impairment of one bakery-cafe , partially offset by a gain related to the
Columbia Strategic Cash Portfolio and the Company-owned life insurance program, and immaterial items. Other
expense, net for fiscal 2008 was primarily comprised of a charge attributable to the Columbia Strategic Cash
Portfolio, partially offset by interest income, and immaterial items.
Income Taxes
The provision for income taxes increased to $53.1 million in fiscal 2009 compared to $41.3 million in fiscal
2008. The tax provision for fiscal 2009 and fiscal 2008 reflects a combined federal, state, and local effective tax rate
of 37.9 percent and 37.4 percent, respectively. The increase in the effective tax rate between fiscal 2009 and 2008
33