Panera Bread 2010 Annual Report Download - page 68
Download and view the complete annual report
Please find page 68 of the 2010 Panera Bread annual report below. You can navigate through the pages in the report by either clicking on the pages listed below, or by using the keyword search tool below to find specific information within the annual report.-
 1
1 -
2
-
3
-
4
-
5
-
6
-
7
-
8
-
9
-
10
-
11
-
12
-
13
-
14
-
15
-
16
-
17
-
18
-
19
-
20
-
21
-
22
-
23
-
24
-
25
-
26
-
27
-
28
-
29
-
30
-
31
-
32
-
33
-
34
-
35
-
36
-
37
-
38
-
39
-
40
-
41
-
42
-
43
-
44
-
45
-
46
-
47
-
48
-
49
-
50
-
51
-
52
-
53
-
54
-
55
-
56
-
57
-
 58
58 -
 59
59 -
 60
60 -
 61
61 -
 62
62 -
 63
63 -
 64
64 -
 65
65 -
 66
66 -
 67
67 -
 68
68 -
 69
69 -
 70
70 -
 71
71 -
 72
72 -
 73
73 -
 74
74 -
 75
75 -
 76
76 -
 77
77 -
 78
78 -
79
-
80
-
81
-
82
-
83
-
84
-
85
-
86
-
87
-
88
-
89
-
90
-
91
-
92
-
93
-
94
-
95
-
96
-
97
-
98
 |
 |
the use of unobservable inputs when measuring fair value. The following describes the three levels of inputs used to
measure fair value:
Level 1 Quoted market prices in active markets for identical assets or liabilities.
Level 2 Observable market based inputs or unobservable inputs that are corroborated by market data.
Level 3 Unobservable inputs that are not corroborated by market data.
On December 30, 2009, the Company adopted the updated guidance issued by the Financial Accounting
Standards Board (“FASB”) related to fair value measurements and disclosures, which requires a reporting entity to
separately disclose the amounts of significant transfers in and out of Level 1 and Level 2 fair value measurements
and to describe the reasons for the transfers. The updated guidance also requires that an entity provide fair value
measurement disclosures for each class of assets and liabilities and disclosures about the valuation techniques and
inputs used to measure fair value for both recurring and non-recurring Level 2 and Level 3 fair value measurements.
The adoption of this updated guidance did not have an impact on the Company’s consolidated results of operations
or financial condition.
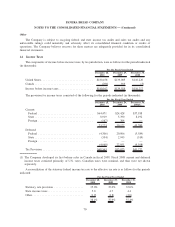
The Company’s $44.5 million and $115.9 million in cash equivalents at December 28, 2010 and December 29,
2009, respectively, were carried at fair value in the Consolidated Balance Sheets based on quoted market prices for
identical securities (Level 1 inputs). The Company’s remaining cash balance in the Consolidated Balance Sheets is
held in FDIC insured accounts. In fiscal year 2010, the Company invested in municipal industrial revenue bonds in
the amount of $1.5 million and valued these bonds using Level 2 inputs as they can be corroborated by market data.
Historically, the Company invested a portion of its cash balances on hand in a private placement of units of
beneficial interest in the Columbia Strategic Cash Portfolio, which was an enhanced cash fund previously sold as an
alternative to traditional money-market funds. Prior to the fourth quarter of fiscal 2007, the amounts were
appropriately classified as trading securities in cash and cash equivalents in the Consolidated Balance Sheets as the
fund was considered both short-term and highly liquid in nature. The Columbia Strategic Cash Portfolio included
investments in certain asset backed securities and structured investment vehicles that were collateralized by
sub-prime mortgage securities or related to mortgage securities, among other assets. As a result of adverse market
conditions that unfavorably affected the fair value and liquidity availability of collateral underlying the Columbia
Strategic Cash Portfolio, it was overwhelmed with withdrawal requests from investors and the Columbia Strategic
Cash Portfolio was closed with a restriction placed upon the cash redemption ability of its holders in the fourth
quarter of fiscal 2007. As such, the Company classified the Columbia Strategic Cash Portfolio units in short-term
and long-term investments rather than cash and cash equivalents in the Consolidated Balance Sheets and carried the
investments at fair value.
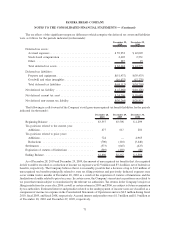
As the Columbia Strategic Cash Portfolio units were no longer trading and, therefore, had little or no price
transparency, the Company assessed the fair value of the underlying collateral for the Columbia Strategic Cash
Portfolio through review of current investment ratings, as available, coupled with the evaluation of the liquidation
value of assets held by each investment and their subsequent distribution of cash. The Company then utilized this
assessment of the underlying collateral from multiple indicators of fair value, which were then adjusted to reflect the
expected timing of disposition and market risks to arrive at an estimated fair value of the Columbia Strategic Cash
Portfolio units. During fiscal 2009, the Company received $5.5 million of cash redemptions, which fully redeemed
the Company’s remaining units in the Columbia Strategic Cash Portfolio. The Columbia Strategic Cash Portfolio
units had an estimated fair value of $0.650 per unit, or $4.1 million, as of December 30, 2008, and $0.960 per unit, or
$23.2 million, as of the date of adopting the fair value accounting standard, December 26, 2007. Based on the
valuation methodology used to determine the fair value, the Columbia Strategic Cash Portfolio was classified within
Level 3 of the fair value hierarchy. Realized and unrealized gains/(losses) relating to the Columbia Strategic Cash
Portfolio were classified in other expense, net in the Consolidated Statements of Operations. The following table
61
PANERA BREAD COMPANY
NOTES TO THE CONSOLIDATED FINANCIAL STATEMENTS — (Continued)