Panera Bread 2010 Annual Report Download - page 34
Download and view the complete annual report
Please find page 34 of the 2010 Panera Bread annual report below. You can navigate through the pages in the report by either clicking on the pages listed below, or by using the keyword search tool below to find specific information within the annual report.-
 1
1 -
2
-
3
-
4
-
5
-
6
-
7
-
8
-
9
-
10
-
11
-
12
-
13
-
14
-
15
-
16
-
17
-
18
-
19
-
20
-
21
-
22
-
23
-
 24
24 -
 25
25 -
 26
26 -
 27
27 -
 28
28 -
 29
29 -
 30
30 -
 31
31 -
 32
32 -
 33
33 -
 34
34 -
 35
35 -
 36
36 -
 37
37 -
 38
38 -
 39
39 -
 40
40 -
 41
41 -
 42
42 -
 43
43 -
 44
44 -
45
-
46
-
47
-
48
-
49
-
50
-
51
-
52
-
53
-
54
-
55
-
56
-
57
-
58
-
59
-
60
-
61
-
62
-
63
-
64
-
65
-
66
-
67
-
68
-
69
-
70
-
71
-
72
-
73
-
74
-
75
-
76
-
77
-
78
-
79
-
80
-
81
-
82
-
83
-
84
-
85
-
86
-
87
-
88
-
89
-
90
-
91
-
92
-
93
-
94
-
95
-
96
-
97
-
98
 |
 |

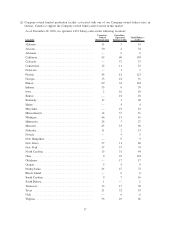
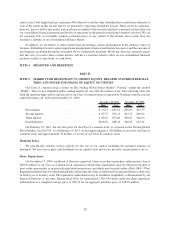
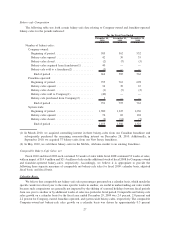
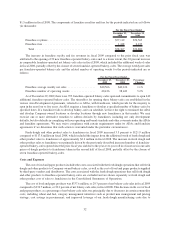
Bakery-cafe Composition
The following table sets forth certain bakery-cafe data relating to Company-owned and franchise-operated
bakery-cafes for the periods indicated:
December 28,
2010
December 29,
2009
December 30,
2008
For the Fiscal Year Ended
Number of bakery-cafes:
Company-owned:
Beginning of period ........................ 585 562 532
Bakery-cafes opened ....................... 42 30 35
Bakery-cafes closed ........................ (2) (7) (5)
Bakery-cafes acquired from franchisees(1) . . . .... 40 — —
Bakery-cafe sold to a franchisee(2) ............. (3) — —
End of period ........................... 662 585 562
Franchise-operated:
Beginning of period ........................ 795 763 698
Bakery-cafes opened ....................... 34 39 67
Bakery-cafes closed ........................ (1) (7) (2)
Bakery-cafes sold to Company(1) .............. (40) — —
Bakery-cafe purchased from Company(2) ........ 3 — —
End of period ........................... 791 795 763
System-wide:
Beginning of period ........................ 1,380 1,325 1,230
Bakery-cafes opened ....................... 76 69 102
Bakery-cafes closed ........................ (3) (14) (7)
End of period ........................... 1,453 1,380 1,325
(1) In March 2010, we acquired controlling interest in three bakery-cafes from our Canadian franchisee and
subsequently purchased the remaining noncontrolling interest on December 28, 2010. Additionally, in
September 2010, we acquired 37 bakery-cafes from our New Jersey franchisee.
(2) In May 2010, we sold three bakery-cafes in the Mobile, Alabama market to an existing franchisee.
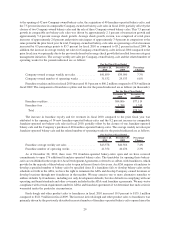
Comparable Bakery-Cafe Sales, net
Fiscal 2010 and fiscal 2009 each contained 52 weeks of sales while fiscal 2008 contained 53 weeks of sales,
with an impact of $14.4 million and $21.4 million of sales in the additional week of fiscal 2008 for Company-owned
and franchise-operated bakery-cafes, respectively. Accordingly, we believe it is appropriate to provide the
following three separate measures of comparable net bakery-cafe sales for fiscal 2009: calendar basis, adjusted
fiscal basis, and fiscal basis.
Calendar Basis
We believe that comparable net bakery-cafe sales percentages presented on a calendar basis, which match the
specific weeks in a fiscal year to the same specific weeks in another, are useful in understanding our sales results
because such comparisons are generally not impacted by the shifting of seasonal holidays between fiscal periods
from one year to another or by additional weeks of sales in a particular fiscal period. Comparable net bakery-cafe
sales growth on a calendar basis for the fiscal year ended December 29, 2009 was 2.4 percent, 2.0 percent and
2.2 percent for Company-owned, franchise-operated, and system-wide bakery-cafes, respectively. The comparable
Company-owned net bakery-cafe sales growth on a calendar basis was driven by approximately 0.3 percent
27