Panera Bread 2010 Annual Report Download - page 38
Download and view the complete annual report
Please find page 38 of the 2010 Panera Bread annual report below. You can navigate through the pages in the report by either clicking on the pages listed below, or by using the keyword search tool below to find specific information within the annual report.-
 1
1 -
2
-
3
-
4
-
5
-
6
-
7
-
8
-
9
-
10
-
11
-
12
-
13
-
14
-
15
-
16
-
17
-
18
-
19
-
20
-
21
-
22
-
23
-
24
-
25
-
26
-
27
-
 28
28 -
 29
29 -
 30
30 -
 31
31 -
 32
32 -
 33
33 -
 34
34 -
 35
35 -
 36
36 -
 37
37 -
 38
38 -
 39
39 -
 40
40 -
 41
41 -
 42
42 -
 43
43 -
 44
44 -
 45
45 -
 46
46 -
 47
47 -
 48
48 -
49
-
50
-
51
-
52
-
53
-
54
-
55
-
56
-
57
-
58
-
59
-
60
-
61
-
62
-
63
-
64
-
65
-
66
-
67
-
68
-
69
-
70
-
71
-
72
-
73
-
74
-
75
-
76
-
77
-
78
-
79
-
80
-
81
-
82
-
83
-
84
-
85
-
86
-
87
-
88
-
89
-
90
-
91
-
92
-
93
-
94
-
95
-
96
-
97
-
98
 |
 |

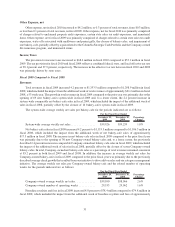
Other Expense, net
Other expense, net in fiscal 2010 increased to $4.2 million, or 0.3 percent of total revenues, from $0.3 million,
or less than 0.1 percent of total revenues, in fiscal 2009. Other expense, net for fiscal 2010 was primarily comprised
of charges related to unclaimed property audit exposures, certain state sales tax audit exposures, and immaterial
items. Other expense, net for fiscal 2009 was primarily comprised of charges related to certain state sales tax audit
exposures, write-offs associated with smallwares and panini grills, the closure of bakery-cafes, and impairment of
one bakery-cafe, partially offset by a gain related to the Columbia Strategic Cash Portfolio and the Company-owned
life insurance program, and immaterial items.
Income Taxes
The provision for income taxes increased to $68.6 million in fiscal 2010 compared to $53.1 million in fiscal
2009. The tax provision for fiscal 2010 and fiscal 2009 reflects a combined federal, state, and local effective tax rate
of 38.1 percent and 37.9 percent, respectively. The increase in the effective tax rate between fiscal 2010 and 2009
was primarily driven by state taxes.
Fiscal 2009 Compared to Fiscal 2008
Revenues
Total revenues in fiscal 2009 increased 4.2 percent to $1,353.5 million compared to $1,298.9 million in fiscal
2008, which included the impact from the additional week of total revenues of approximately $21.2 million in fiscal
2008, a 53 week year. The growth in total revenues in fiscal 2009 compared to the prior year was primarily due to the
opening of 69 new bakery-cafes system-wide in fiscal 2009 and, to a lesser extent, the 2.2 percent increase in
system-wide comparable net bakery-cafe sales in fiscal 2009, which included the impact of the additional week of
sales in fiscal 2008, partially offset by the closure of 14 bakery-cafes system-wide in fiscal 2009.
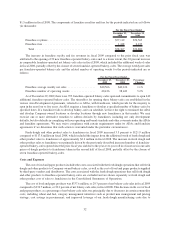
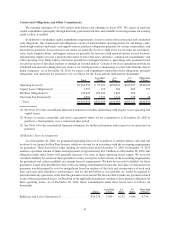
The system-wide average weekly net sales per bakery-cafe for the periods indicated are as follows:
December 29,
2009
December 30,
2008
Percentage
Change
For the Fiscal Year Ended
System-wide average weekly net sales ................ $39,926 $39,239 1.8%
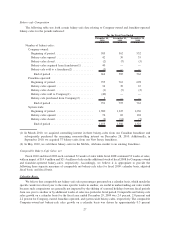
Net bakery-cafe sales in fiscal 2009 increased 4.2 percent to $1,153.3 million compared to $1,106.3 million in
fiscal 2008, which included the impact from the additional week of net bakery-cafe sales of approximately
$17.5 million in fiscal 2008. The increase in net bakery-cafe sales in fiscal 2009 compared to the prior fiscal year
was primarily due to the opening of 30 new Company-owned bakery-cafes and, to a lesser extent, the previously
described 2.4 percent increase in comparable Company-owned net bakery-cafe sales in fiscal 2009, which included
the impact of the additional week of sales in fiscal 2008, partially offset by the closure of seven Company-owned
bakery-cafes. In total, Company-owned net bakery-cafe sales as a percentage of total revenues remained consistent
at 85.2 percent in both fiscal 2009 and fiscal 2008. In addition, the increase in average weekly net sales for
Company-owned bakery-cafes in fiscal 2009 compared to the prior fiscal year was primarily due to the previously
described average check growth that resulted from our initiative to drive add-on sales and our category management
initiative. The average weekly net sales per Company-owned bakery-cafe and the related number of operating
weeks for the periods indicated are as follows:
December 29,
2009
December 30,
2008
Percentage
Change
For the Fiscal Year Ended
Company-owned average weekly net sales ............. $39,050 $38,066 2.6%
Company-owned number of operating weeks ........... 29,533 29,062 1.6%
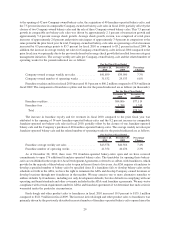
Franchise royalties and fees in fiscal 2009 increased 4.8 percent to $78.4 million compared to $74.8 million in
fiscal 2008, which included the impact from the additional week of franchise royalties and fees of approximately
31