Panera Bread 2010 Annual Report Download - page 41
Download and view the complete annual report
Please find page 41 of the 2010 Panera Bread annual report below. You can navigate through the pages in the report by either clicking on the pages listed below, or by using the keyword search tool below to find specific information within the annual report.-
 1
1 -
2
-
3
-
4
-
5
-
6
-
7
-
8
-
9
-
10
-
11
-
12
-
13
-
14
-
15
-
16
-
17
-
18
-
19
-
20
-
21
-
22
-
23
-
24
-
25
-
26
-
27
-
28
-
29
-
30
-
 31
31 -
 32
32 -
 33
33 -
 34
34 -
 35
35 -
 36
36 -
 37
37 -
 38
38 -
 39
39 -
 40
40 -
 41
41 -
 42
42 -
 43
43 -
 44
44 -
 45
45 -
 46
46 -
 47
47 -
 48
48 -
 49
49 -
 50
50 -
 51
51 -
52
-
53
-
54
-
55
-
56
-
57
-
58
-
59
-
60
-
61
-
62
-
63
-
64
-
65
-
66
-
67
-
68
-
69
-
70
-
71
-
72
-
73
-
74
-
75
-
76
-
77
-
78
-
79
-
80
-
81
-
82
-
83
-
84
-
85
-
86
-
87
-
88
-
89
-
90
-
91
-
92
-
93
-
94
-
95
-
96
-
97
-
98
 |
 |

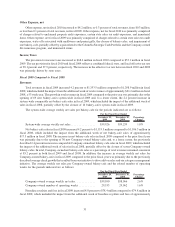
was primarily the result of the impact of certain changes in state tax laws resulting in an increase in the
year-over-year effective tax rate for fiscal 2009.
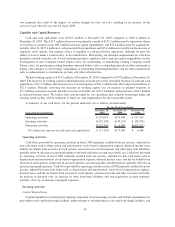
Liquidity and Capital Resources
Cash and cash equivalents were $229.3 million at December 28, 2010 compared to $246.4 million at
December 29, 2009. This $17.1 million decrease was primarily a result of $153.5 million used to repurchase shares
of our Class A common stock, $82.2 million used on capital expenditures, and $52.2 million used for acquisitions,
partially offset by $237.6 million of cash generated from operations and $25.6 million received from the exercise of
employee stock options. Our primary source of liquidity is cash provided by operations, although we have the
ability to borrow under a credit facility, as described below. Historically, our principal requirements for cash have
primarily resulted from the cost of food and paper products, employee labor, and our capital expenditures for the
development of new Company-owned bakery-cafes, for maintaining or remodeling existing Company-owned
bakery-cafes, for purchasing existing franchise-operated bakery-cafes or ownership interests in other restaurant or
bakery-cafe concepts, for developing, maintaining, or remodeling fresh dough facilities, and for other capital needs
such as enhancements to information systems and other infrastructure.
We had working capital of $119.2 million at December 28, 2010 compared to $179.8 million at December 29,
2009. The decrease in working capital resulted primarily from the previously described decrease in cash and cash
equivalents of $17.1 million and an increase in accrued expenses of $61.9 million and other long-term liabilities of
$12.3 million. Partially offsetting the decrease in working capital was an increase in prepaid expenses of
$7.7 million, an increase in trade and other accounts receivable, net of $13.2 million, and an increase of $4.7 million
in deferred income taxes. We believe that cash provided by our operations and available borrowings under our
existing credit facility will be sufficient to fund our cash requirements for the foreseeable future.
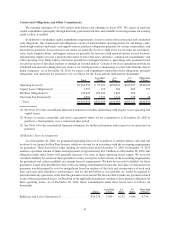
A summary of our cash flows, for the periods indicated, are as follows (in thousands):
Cash (used in) provided by:
December 28,
2010
December 29,
2009
December 30,
2008
For the Fiscal Year Ended
Operating activities ............................ $237,634 $214,904 $ 157,324
Investing activities ............................. $(132,199) $ (49,219) $ (48,705)
Financing activities ............................ $(122,536) $ 6,005 $(102,151)
Net (decrease) increase in cash and cash equivalents . . $ (17,101) $171,690 $ 6,468
Operating Activities
Cash flows provided by operating activities in fiscal 2010 primarily resulted from net income, adjusted for
non-cash items such as depreciation and amortization, stock-based compensation expense, deferred income taxes
and the tax benefit from exercise of stock options, an increase in accrued expenses and other long-term liabilities,
partially offset by an increase in prepaid expenses and trade and other accounts receivable, net. Cash flows provided
by operating activities in fiscal 2009 primarily resulted from net income, adjusted for non-cash items such as
depreciation and amortization, stock-based compensation expense, deferred income taxes, and the tax benefit from
exercise of stock options, an increase in accrued expenses, accounts payable, and deferred rent, partially offset by an
increase in prepaid expenses. Cash flows provided by operating activities in fiscal 2008 primarily resulted from net
income, adjusted for non-cash items such as depreciation and amortization, stock-based compensation expense,
deferred taxes, and the tax benefit from exercise of stock options, a decrease in trade and other accounts receivable,
an increase in deferred rent, an increase in other long-term liabilities and non-acquisition accrued expenses,
partially offset by an increase in prepaid expenses.
Investing Activities
Capital Expenditures
Capital expenditures are the largest ongoing component of our investing activities and include expenditures for
new bakery-cafes and fresh dough facilities, improvements to existing bakery-cafes and fresh dough facilities, and
34