Panera Bread 2004 Annual Report Download - page 56
Download and view the complete annual report
Please find page 56 of the 2004 Panera Bread annual report below. You can navigate through the pages in the report by either clicking on the pages listed below, or by using the keyword search tool below to find specific information within the annual report.-
 1
1 -
2
-
3
-
4
-
5
-
6
-
7
-
8
-
9
-
10
-
11
-
12
-
13
-
14
-
15
-
16
-
17
-
18
-
19
-
20
-
21
-
22
-
23
-
24
-
25
-
26
-
27
-
28
-
29
-
30
-
31
-
32
-
33
-
34
-
35
-
36
-
37
-
38
-
39
-
40
-
41
-
42
-
43
-
44
-
45
-
 46
46 -
 47
47 -
 48
48 -
 49
49 -
 50
50 -
 51
51 -
 52
52 -
 53
53 -
 54
54 -
 55
55 -
 56
56 -
 57
57 -
 58
58 -
 59
59 -
 60
60 -
 61
61 -
 62
62 -
 63
63 -
 64
64 -
 65
65 -
 66
66 -
67
-
68
 |
 |

December 25,
2004
(as restated)
December 27,
2003
(in thousands)
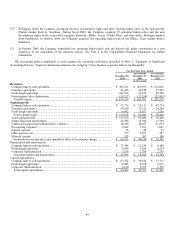
Segment assets:
Company bakery-cafe operations ............................................................................................................... $ 199,564 $ 147,920
Franchise operations................................................................................................................................... 1,778 1,117
Fresh dough operations............................................................................................................................... 39,968 33,442
Total segment assets ................................................................................................................................ $ 241,310 $ 182,479
Total segment assets ................................................................................................................................... $ 241,310 $ 182,479
Unallocated trade and other accounts receivable........................................................................................ 6,499 4,462
Unallocated inventories .............................................................................................................................. — 558
Unallocated property and equipment .......................................................................................................... 12,291 11,340
Unallocated deposits and other................................................................................................................... 2,613 2,688
Other unallocated assets ............................................................................................................................. 61,959 55,308
Total assets............................................................................................................................................... $ 324,672 $ 256,835
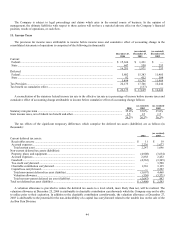
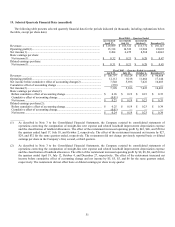
18. Earnings Per Share
The following table sets forth the computation of basic and diluted earnings per share (in thousands, except for per share data):
For the Fiscal Years Ended
December 25,
2004
(as restated)
December 27,
2003
(as restated)
December 28,
2002
Amounts used for basic and diluted per share calculations:
Income before cumulative effect of accounting change ....................................................... $ 38,580 $ 30,669 $ 21,300
Cumulative effect of accounting change, net of tax ............................................................. — (239) —
Net income ........................................................................................................................... $ 38,580 $ 30,430 $ 21,300
Weighted average number of shares outstanding — basic ................................................... 30,154 29,733 28,923
Effect of dilutive securities:
Employee stock options...................................................................................................... 614 690 968
Weighted average number of shares outstanding — diluted ................................................ 30,768 30,423 29,891
Basic earnings per common share:
Before cumulative effect of accounting change ................................................................... $ 1.28 $ 1.03 $ 0.74
Cumulative effect of accounting change .............................................................................. — (0.01) —
Net income ........................................................................................................................... $ 1.28 $ 1.02 $ 0.74
Diluted earnings per common share:
Before cumulative effect of accounting change ................................................................... $ 1.25 $ 1.01 $ 0.71
Cumulative effect of accounting change .............................................................................. — (0.01) —
Net income ........................................................................................................................... $ 1.25 $ 1.00 $ 0.71
For the years ended December 25, 2004, December 27, 2003, and December 28, 2002, outstanding options for 0.5 million, 0.4
million, and 0.3 million shares, respectively, were excluded in calculating diluted earnings per share as the exercise price exceeded
fair market value and inclusion would have been anti-dilutive.
50