Panera Bread 2004 Annual Report Download - page 22
Download and view the complete annual report
Please find page 22 of the 2004 Panera Bread annual report below. You can navigate through the pages in the report by either clicking on the pages listed below, or by using the keyword search tool below to find specific information within the annual report.-
 1
1 -
2
-
3
-
4
-
5
-
6
-
7
-
8
-
9
-
10
-
11
-
 12
12 -
 13
13 -
 14
14 -
 15
15 -
 16
16 -
 17
17 -
 18
18 -
 19
19 -
 20
20 -
 21
21 -
 22
22 -
 23
23 -
 24
24 -
 25
25 -
 26
26 -
 27
27 -
 28
28 -
 29
29 -
 30
30 -
 31
31 -
 32
32 -
33
-
34
-
35
-
36
-
37
-
38
-
39
-
40
-
41
-
42
-
43
-
44
-
45
-
46
-
47
-
48
-
49
-
50
-
51
-
52
-
53
-
54
-
55
-
56
-
57
-
58
-
59
-
60
-
61
-
62
-
63
-
64
-
65
-
66
-
67
-
68
 |
 |

2003, the negative impact of the power outage and hurricane in 2003, and the impact of ROI based real estate decisions relating to
new stores that negatively impacted existing store performance in 2003. In addition, during the second quarter of 2003, the Company
began to implement increased staffing and other initiatives that focused on quality and speed of customer service in Company-owned
bakery-cafes. The implementation of these initiatives occurred on a trailing basis at franchised bakery-cafes, as the Company initially
tests changes in Company-owned bakery cafes before recommending changes to its franchisees. Additionally, in the second half of
2003 the Company’s sales growth was negatively impacted by the increased popularity of “low carbohydrate” diet trends.
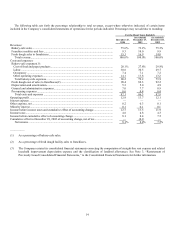
Fiscal Year 2004 Compared to Fiscal Year 2003 (as restated)
Results of Operations
Revenues
Total Company revenues for the fifty-two weeks ended December 25, 2004 increased 31.7% to $479.1 million compared to $363.7
million for the fifty-two weeks ended December 27, 2003. The growth in total revenues for the fifty-two weeks ended December 25,
2004, as compared to the prior year, is primarily due to the opening of 143 new bakery-cafes in 2004 as well as increases in system-
wide comparable bakery-cafe sales of 2.7% for the fifty-two weeks ended December 25, 2004. The system-wide average weekly sales
per bakery-cafe and the related number of operating weeks for the fifty-two weeks ended December 25, 2004 and December 27, 2003
are as follows:
For the Fifty-Two Weeks Ended
December 25,
2004
December 27,
2003
System-wide average weekly sales....................................................................................................... $ 36,008 $ 35,617
System-wide number of operating weeks............................................................................................. 34,470 27,427
Average weekly sales is calculated by dividing total net sales by operating weeks. Accordingly, year over year growth reflects all
sales, whereas comp store sales reflects only sales for those bakery-cafes that have been open for more than 18 months.
Bakery-cafe sales for the fifty-two weeks ended December 25, 2004 for the Company increased 36.2% to $362.1 million from
$265.9 million for the fifty-two weeks ended December 27, 2003. Company bakery-cafe sales as a percentage of total revenue
increased by 2.5 percentage points for the fifty-two weeks ended December 25, 2004 compared to the fifty-two weeks ended
December 27, 2003, and fresh dough sales to franchisees as a percentage of total revenue decreased by 1.8 percentage points for the
fifty-two weeks ended December 25, 2004 compared to the fifty-two weeks ended December 27, 2003, primarily as a result of the
increase in the number of Company bakery-cafe openings. The increase in bakery-cafe sales is primarily due to the impact of a full
year’s operations of the 29 Company bakery-cafes opened and 15 bakery-cafes acquired in 2003, the opening of 54 Company-owned
bakery-cafes in 2004, and the 2.9% increase in comparable bakery-cafe sales for the fifty-two weeks ended December 25, 2004. The
average weekly sales per Company-owned bakery-cafe and the related number of operating weeks for the fifty-two weeks ended
December 25, 2004 and December 27, 2003 are as follows:
For the Fifty-Two Weeks Ended
December 25,
2004
December 27,
2003
Company-owned average weekly sales................................................................................................ $ 35,620 $ 35,198
Company-owned number of operating weeks ...................................................................................... 10,166 7,555
Franchise royalties and fees rose 22.7% to $44.4 million for the fifty-two weeks ended December 25, 2004 from $36.2 million for
the fifty-two weeks ended December 27, 2003. The components of franchise royalties and fees are as follows (in thousands):
For the Fifty-Two Weeks Ended
December 25,
2004
December 27,
2003
Franchise royalties................................................................................................................................ $ 41,199 $ 32,903
Franchise fees ....................................................................................................................................... 3,250 3,342
Total.................................................................................................................................................... $ 44,449 $ 36,245
The increase in royalty revenue can be attributed to the impact of a full year’s operations of the 102 franchised bakery-cafes
opened in 2003, the opening of 89 franchised bakery-cafes in 2004, and the 2.6% increase in comparable franchise-operated bakery-
16