Panera Bread 2004 Annual Report Download - page 14
Download and view the complete annual report
Please find page 14 of the 2004 Panera Bread annual report below. You can navigate through the pages in the report by either clicking on the pages listed below, or by using the keyword search tool below to find specific information within the annual report.-
 1
1 -
2
-
3
-
 4
4 -
 5
5 -
 6
6 -
 7
7 -
 8
8 -
 9
9 -
 10
10 -
 11
11 -
 12
12 -
 13
13 -
 14
14 -
 15
15 -
 16
16 -
 17
17 -
 18
18 -
 19
19 -
 20
20 -
 21
21 -
 22
22 -
 23
23 -
 24
24 -
25
-
26
-
27
-
28
-
29
-
30
-
31
-
32
-
33
-
34
-
35
-
36
-
37
-
38
-
39
-
40
-
41
-
42
-
43
-
44
-
45
-
46
-
47
-
48
-
49
-
50
-
51
-
52
-
53
-
54
-
55
-
56
-
57
-
58
-
59
-
60
-
61
-
62
-
63
-
64
-
65
-
66
-
67
-
68
 |
 |

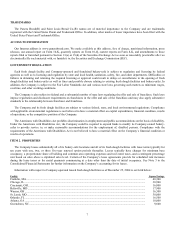
Facility Square Footage
Kansas City, KS ................................................................................................................................................................ 17,000
Detroit, MI......................................................................................................................................................................... 19,590
Dallas, TX ......................................................................................................................................................................... 7,800
Minneapolis, MN............................................................................................................................................................... 10,420
Ontario, CA ....................................................................................................................................................................... 13,900
Fairfield, NJ....................................................................................................................................................................... 20,200
Denver, CO........................................................................................................................................................................ 10,000
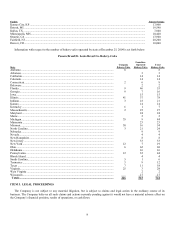
Information with respect to the number of bakery-cafes operated by state at December 25, 2004 is set forth below:
Panera Bread/St. Louis Bread Co. Bakery-Cafes
State
Company
Bakery-Cafes
Franchise-
Operated
Bakery-Cafes
Total
Bakery-Cafes
Alabama ................................................................................................................................ 8 8
Arkansas ................................................................................................................................ 3 3
California............................................................................................................................... 14 14
Colorado ................................................................................................................................ 14 14
Connecticut............................................................................................................................ 2 6 8
Delaware................................................................................................................................ 2 2
Florida ................................................................................................................................... 9 46 55
Georgia .................................................................................................................................. 9 7 16
Iowa....................................................................................................................................... 15 15
Illinois.................................................................................................................................... 41 37 78
Indiana................................................................................................................................... 3 18 21
Kansas ................................................................................................................................... 14 14
Kentucky ............................................................................................................................... 6 1 7
Massachusetts........................................................................................................................ 2 25 27
Maryland ............................................................................................................................... 24 24
Maine..................................................................................................................................... 2 2
Michigan................................................................................................................................ 35 9 44
Minnesota .............................................................................................................................. 23 23
Missouri................................................................................................................................. 38 16 54
North Carolina....................................................................................................................... 3 21 24
Nebraska................................................................................................................................ 9 9
Nevada................................................................................................................................... 4 4
New Hampshire..................................................................................................................... 8 8
New Jersey ............................................................................................................................ 33 33
New York .............................................................................................................................. 12 7 19
Ohio....................................................................................................................................... 6 62 68
Oklahoma .............................................................................................................................. 16 16
Pennsylvania.......................................................................................................................... 12 32 44
Rhode Island.......................................................................................................................... 4 4
South Carolina....................................................................................................................... 5 1 6
Tennessee .............................................................................................................................. 3 9 12
Texas ..................................................................................................................................... 7 11 18
Virginia.................................................................................................................................. 25 3 28
West Virginia ........................................................................................................................ 2 2
Wisconsin ..............................................................................................................................
17 17
Totals .................................................................................................................................. 226 515 741
ITEM 3. LEGAL PROCEEDINGS
The Company is not subject to any material litigation, but is subject to claims and legal action in the ordinary course of its
business. The Company believes all such claims and actions currently pending against it would not have a material adverse effect on
the Company’s financial position, results of operations, or cash flows.
8