Panera Bread 2004 Annual Report Download - page 43
Download and view the complete annual report
Please find page 43 of the 2004 Panera Bread annual report below. You can navigate through the pages in the report by either clicking on the pages listed below, or by using the keyword search tool below to find specific information within the annual report.-
 1
1 -
2
-
3
-
4
-
5
-
6
-
7
-
8
-
9
-
10
-
11
-
12
-
13
-
14
-
15
-
16
-
17
-
18
-
19
-
20
-
21
-
22
-
23
-
24
-
25
-
26
-
27
-
28
-
29
-
30
-
31
-
32
-
 33
33 -
 34
34 -
 35
35 -
 36
36 -
 37
37 -
 38
38 -
 39
39 -
 40
40 -
 41
41 -
 42
42 -
 43
43 -
 44
44 -
 45
45 -
 46
46 -
 47
47 -
 48
48 -
 49
49 -
 50
50 -
 51
51 -
 52
52 -
 53
53 -
54
-
55
-
56
-
57
-
58
-
59
-
60
-
61
-
62
-
63
-
64
-
65
-
66
-
67
-
68
 |
 |

Fiscal Year
The Company’s fiscal year ends on the last Saturday in December. The Company’s fiscal year consists of 13 four-week periods,
with the first, second, and third quarters ending 16 weeks, 28 weeks, and 40 weeks, respectively, into the fiscal year. In 2005, the
Company intends to change its fiscal week to end on Tuesday rather than Saturday. As a result, the Company’s 2005 fiscal year will
end on December 27, 2005 and consist of fifty-two and a half weeks rather than the fifty-three week year that would have resulted
without the calendar change. The additional days in fiscal 2005 will occur in the first quarter, resulting in the first quarter being
sixteen and a half weeks. In fiscal year 2006, the Company intends to convert to a 4-5-4 fiscal calendar whereby each quarter will
include 13 weeks.
Earnings Per Share Data
Earnings per share is based on the weighted average number of shares outstanding during the period after consideration of the
dilutive effect, if any, for common stock equivalents, including stock options. Earnings per common share are computed in accordance
with SFAS No. 128 “Earnings Per Share,” which requires companies to present basic earnings per share and diluted earnings per
share. Basic earnings per share are computed by dividing net income by the weighted average number of shares of common stock
outstanding during the year. Diluted earnings per common share are computed by dividing net income by the weighted average
number of shares of common stock outstanding and dilutive securities outstanding during the year. Shares of common stock
outstanding have been retroactively adjusted to give effect to the two-for-one stock split on June 24, 2002.
Fair Value of Financial Instruments
The carrying amount of the Company’s accounts receivable and accounts payable approximate their fair values due to the short-
term maturity of these instruments. In addition, held-to-maturity securities are stated at amortized cost, adjusted for amortization of
premiums to maturity using the effective interest method, which approximates fair value at December 25, 2004.
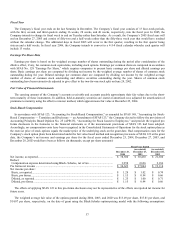
Stock-Based Compensation
In accordance with SFAS 123, “Accounting for Stock-Based Compensation,” as amended by SFAS 148, “Accounting for Stock-
Based Compensation — Transition and Disclosure — an Amendment of SFAS 123,” the Company elected to follow the provisions of
Accounting Principles Board Opinion No. 25 (APB 25), “Accounting for Stock Issued to Employees,” and provide the required pro
forma disclosure in the footnotes to the financial statements as if the measurement provisions of SFAS 123 had been adopted.
Accordingly, no compensation costs have been recognized in the Consolidated Statements of Operations for the stock option plans as
the exercise price of stock options equals the market price of the underlying stock on the grant date. Had compensation costs for the
Company’s stock option plans been determined under the fair value based method and recognition provisions of SFAS 123 at the grant
date, the Company’s net income and earnings per share for the fiscal years ended December 25, 2004, December 27, 2003, and
December 28, 2002 would have been as follows (in thousands, except per share amounts):
Fiscal Year Ended
December 25,
2004
(as restated)
December 27,
2003
(as restated)
December 28,
2002
Net income, as reported........................................................................................................ $ 38,580 $ 30,430 $ 21,300
Deduct:
Compensation expense determined using Black- Scholes, net of tax................................. 3,958 2,626 2,186
Pro forma net income ........................................................................................................... $ 34,622 $ 27,804 $ 19,114
Net income per share:
Basic, as reported................................................................................................................ $ 1.28 $ 1.02 $ 0.74
Basic, pro forma ................................................................................................................. $ 1.15 $ 0.94 $ 0.66
Diluted, as reported............................................................................................................. $ 1.25 $ 1.00 $ 0.71
Diluted, pro forma .............................................................................................................. $ 1.15 $ 0.94 $ 0.66
The effects of applying SFAS 123 in this pro-forma disclosure may not be representative of the effects on reported net income for
future years.
The weighted average fair value of the options granted during 2004, 2003, and 2002 was $13.49 per share, $15.81 per share, and
$14.87 per share, respectively, on the date of grant using the Black-Scholes option-pricing model with the following assumptions:
37