Panera Bread 2004 Annual Report Download - page 26
Download and view the complete annual report
Please find page 26 of the 2004 Panera Bread annual report below. You can navigate through the pages in the report by either clicking on the pages listed below, or by using the keyword search tool below to find specific information within the annual report.-
 1
1 -
2
-
3
-
4
-
5
-
6
-
7
-
8
-
9
-
10
-
11
-
12
-
13
-
14
-
15
-
 16
16 -
 17
17 -
 18
18 -
 19
19 -
 20
20 -
 21
21 -
 22
22 -
 23
23 -
 24
24 -
 25
25 -
 26
26 -
 27
27 -
 28
28 -
 29
29 -
 30
30 -
 31
31 -
 32
32 -
 33
33 -
 34
34 -
 35
35 -
 36
36 -
37
-
38
-
39
-
40
-
41
-
42
-
43
-
44
-
45
-
46
-
47
-
48
-
49
-
50
-
51
-
52
-
53
-
54
-
55
-
56
-
57
-
58
-
59
-
60
-
61
-
62
-
63
-
64
-
65
-
66
-
67
-
68
 |
 |
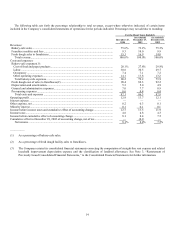
Costs and Expenses (as restated — see Note 3 to the Consolidated Financial Statements)
The cost of food and paper products includes the costs associated with the fresh dough operations that sell fresh dough products to
Company-owned bakery-cafes as well as the cost of food and paper products supplied by third party vendors and distributors. The
costs associated with the fresh dough operations that sell fresh dough products to the franchised bakery-cafes are excluded and are
shown separately as fresh dough cost of sales to franchisees in the Consolidated Statements of Operations. The cost of food and paper
products decreased to 27.8% of bakery-cafe sales for the fifty-two weeks ended December 27, 2003 compared to 29.8% of bakery-
cafe sales for the fifty-two weeks ended December 28, 2002. This decrease in the cost of food and paper products as a percentage of
bakery-cafe sales is primarily due to the Company’s improved leveraging of its fresh dough manufacturing and distribution costs as
more bakery-cafes are opened. For the fifty-two weeks ended December 27, 2003, there was an average of 32.7 bakery-cafes per fresh
dough facility compared to an average of 27.3 for the fifty-two weeks ended December 28, 2002. Additionally, lower ingredient costs,
including the benefits of our new sweet goods contract that commenced during the first quarter of fiscal 2003, further benefited food
cost.
Labor expense was $81.2 million, or 30.5% of bakery-cafe sales, for the fifty-two weeks ended December 27, 2003 compared to
$63.2 million, or 29.7% of bakery-cafe sales, for the fifty-two weeks ended December 28, 2002. The labor expense as a percentage of
bakery-cafe sales increased between the fifty-two weeks ended December 27, 2003 and the fifty-two weeks ended December 28, 2002
primarily as a result of our customer service initiatives in fiscal 2003 related to quality and speed of service as well as table delivery
service testing and the continued commitment to training and staffing our bakery-cafes.
Occupancy costs were $19.0 million, or 7.1% of bakery-cafe sales, for the fifty-two weeks ended December 27, 2003 compared to
$15.4 million, or 7.2% of bakery-cafe sales, for the fifty-two weeks ended December 28, 2002. The occupancy cost as a percentage of
bakery-cafe sales declined for the fifty-two weeks ended December 27, 2003 due to the leveraging of these costs over higher sales
volumes.
Other bakery-cafe operating expenses, which include advertising, retail field overhead, utilities, and other cafe expenses, were
$36.8 million, or 13.8% of bakery-cafe sales, for the fifty-two weeks ended December 27, 2003 compared to $28.0 million, or 13.2%
of bakery-cafe sales, for the fifty-two weeks ended December 28, 2002. The increase in other bakery-cafe operating expenses as a
percentage of bakery-cafe sales for the fifty-two weeks ended December 27, 2003 is primarily due to increased organizational costs
for field management, costs associated with new markets opened which do not yet have multi-unit leverage, and increased recruiting
and training, repair and maintenance, and advertising costs.
For the fifty-two weeks ended December 27, 2003, fresh dough facility cost of sales to franchisees was $55.0 million, or 89.3% of
fresh dough facility sales to franchisees, compared to $38.4 million, or 92.2% of fresh dough facility sales to franchisees, for the fifty-
two weeks ended December 28, 2002. The decrease in the fresh dough cost of sales rate in fiscal 2003 was primarily due to favorable
ingredient costs and the impact of the favorable change in our sweet goods supply agreement, which took effect during the first quarter
of fiscal 2003.
Depreciation and amortization was $18.3 million, or 5.0% of total revenue, for the fifty-two weeks ended December 27, 2003
compared to $13.8 million, or 4.9% of total revenue, for the fifty-two weeks ended December 28, 2002. The increase in depreciation
and amortization as a percentage of total revenue for the fifty-two weeks ended December 27, 2003 compared to the fifty-two weeks
ended December 28, 2002 is primarily due to the impact of a full year’s depreciation of prior year’s capital expenditures and increased
capital expenditures in the current year.
General and administrative expenses were $28.1 million, or 7.7% of total revenue, and $25.0 million, or 8.9% of total revenue, for
the fifty-two weeks ended December 27, 2003 and December 28, 2002, respectively. The decrease in the general and administrative
expense rate between 2003 and 2002 results primarily from higher revenues, which help leverage general and administrative expenses,
and from decreased bonus costs.
Pre-opening expenses, which consist primarily of labor and food costs incurred during in-store training and preparation for
opening, exclusive of manager training costs which are included in general and administrative expenses, of $1.5 million, or 0.4% of
total revenue, for the fifty-two weeks ended December 27, 2003 were consistent with the $1.1 million, or 0.4% of total revenue, of
pre-opening expenses for the fifty-two weeks ended December 28, 2002.
20