Panera Bread 2003 Annual Report Download - page 58
Download and view the complete annual report
Please find page 58 of the 2003 Panera Bread annual report below. You can navigate through the pages in the report by either clicking on the pages listed below, or by using the keyword search tool below to find specific information within the annual report.-
 1
1 -
2
-
3
-
4
-
5
-
6
-
7
-
8
-
9
-
10
-
11
-
12
-
13
-
14
-
15
-
16
-
17
-
18
-
19
-
20
-
21
-
22
-
23
-
24
-
25
-
26
-
27
-
28
-
29
-
30
-
31
-
32
-
33
-
34
-
35
-
36
-
37
-
38
-
39
-
40
-
41
-
42
-
43
-
44
-
45
-
46
-
47
-
 48
48 -
 49
49 -
 50
50 -
 51
51 -
 52
52 -
 53
53 -
 54
54 -
 55
55 -
 56
56 -
 57
57 -
 58
58 -
 59
59 -
 60
60 -
 61
61 -
 62
62 -
 63
63 -
 64
64 -
 65
65 -
 66
66 -
 67
67 -
 68
68
 |
 |

PANERA BREAD COMPANY
NOTES TO THE CONSOLIDATED FINANCIAL STATEMENTS Ì (Continued)
earnings per share as the exercise price exceeded fair market value and inclusion would have been anti-
dilutive.
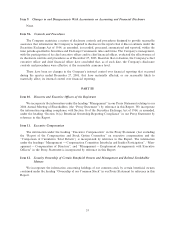
18. Deferred Revenue
During 1999, the Company changed soft drink providers. As a result of this change, the Company
received an upfront payment of $2,530,000, of which approximately $0.8 million and $1.3 million were
recorded as deferred revenue at December 27, 2003 and December 28, 2002, respectively. These funds are
available for both Company-owned and franchised bakery-cafes to cover costs of conversion and transition.
The upfront payments are being allocated at a rate of $3,000 per applicable Company-owned and franchised
bakery-cafe. The Company is then recognizing the $3,000 per Company-owned bakery-cafe over the Ñve-year
life of the soft drink contract. During Ñscal year 2003 and 2002, the Company paid $187,000 and $207,000,
respectively, to franchisees relating to bakery-cafes opened during the year. As of December 27, 2003 and
December 28, 2002, the deferred revenue being amortized by the Company was $652,000 and $410,000,
respectively.
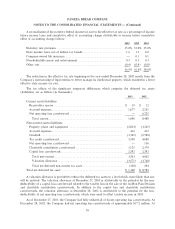
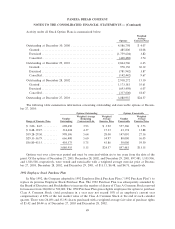
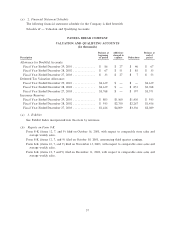
19. Selected Quarterly Financial Data (unaudited)
The following table presents selected quarterly Ñnancial data for the periods indicated (in thousands,
except per share data)
April 19, July 12, October 4, December 27,
2003 2003 2003 2003
Revenues ÏÏÏÏÏÏÏÏÏÏÏÏÏÏÏÏÏÏÏÏÏÏÏÏÏÏÏÏÏÏÏÏÏÏÏÏÏÏÏÏÏÏ $98,631 $78,550 $84,028 $94,677
Operating proÑt ÏÏÏÏÏÏÏÏÏÏÏÏÏÏÏÏÏÏÏÏÏÏÏÏÏÏÏÏÏÏÏÏÏÏÏÏÏ 12,104 9,210 11,456 17,134
Net income before cumulative eÅect of accounting change 7,543 5,691 7,017 10,397
Cumulative eÅect of accounting changeÏÏÏÏÏÏÏÏÏÏÏÏÏÏÏÏÏ (239) Ì Ì Ì
Net income ÏÏÏÏÏÏÏÏÏÏÏÏÏÏÏÏÏÏÏÏÏÏÏÏÏÏÏÏÏÏÏÏÏÏÏÏÏÏ 7,304 5,691 7,017 10,397
Basic earnings per share:
Before cumulative eÅect of accounting change ÏÏÏÏÏÏÏÏÏ $ 0.26 $ 0.19 $ 0.23 $ 0.35
Cumulative eÅect of accounting changeÏÏÏÏÏÏÏÏÏÏÏÏÏÏÏ (0.01) Ì Ì Ì
Net income ÏÏÏÏÏÏÏÏÏÏÏÏÏÏÏÏÏÏÏÏÏÏÏÏÏÏÏÏÏÏÏÏÏÏÏÏÏÏ $ 0.25 $ 0.19 $ 0.23 $ 0.35
Diluted earnings per share:
Before cumulative eÅect of accounting change ÏÏÏÏÏÏÏÏÏ $ 0.25 $ 0.19 $ 0.23 $ 0.34
Cumulative eÅect of accounting changeÏÏÏÏÏÏÏÏÏÏÏÏÏÏÏ (0.01) Ì Ì Ì
Net income ÏÏÏÏÏÏÏÏÏÏÏÏÏÏÏÏÏÏÏÏÏÏÏÏÏÏÏÏÏÏÏÏÏÏÏÏÏÏ $ 0.24 $ 0.19 $ 0.23 $ 0.34
April 20, July 13, October 5, December 28,
2002 2002 2002 2002
Revenues ÏÏÏÏÏÏÏÏÏÏÏÏÏÏÏÏÏÏÏÏÏÏÏÏÏÏÏÏÏÏÏÏÏÏÏÏÏÏÏÏÏÏ $77,005 $62,274 $65,471 $73,001
Operating proÑt ÏÏÏÏÏÏÏÏÏÏÏÏÏÏÏÏÏÏÏÏÏÏÏÏÏÏÏÏÏÏÏÏÏÏÏÏÏ 8,467 6,135 8,285 11,886
Net income ÏÏÏÏÏÏÏÏÏÏÏÏÏÏÏÏÏÏÏÏÏÏÏÏÏÏÏÏÏÏÏÏÏÏÏÏÏÏ 5,225 3,873 5,167 7,500
Basic earnings per share
Net income ÏÏÏÏÏÏÏÏÏÏÏÏÏÏÏÏÏÏÏÏÏÏÏÏÏÏÏÏÏÏÏÏÏÏÏÏÏÏ $ 0.18 $ 0.13 $ 0.18 $ 0.26
Diluted earnings per share
Net income ÏÏÏÏÏÏÏÏÏÏÏÏÏÏÏÏÏÏÏÏÏÏÏÏÏÏÏÏÏÏÏÏÏÏÏÏÏÏ $ 0.17 $ 0.13 $ 0.17 $ 0.25
54