Panera Bread 2003 Annual Report Download - page 21
Download and view the complete annual report
Please find page 21 of the 2003 Panera Bread annual report below. You can navigate through the pages in the report by either clicking on the pages listed below, or by using the keyword search tool below to find specific information within the annual report.-
 1
1 -
2
-
3
-
4
-
5
-
6
-
7
-
8
-
9
-
10
-
 11
11 -
 12
12 -
 13
13 -
 14
14 -
 15
15 -
 16
16 -
 17
17 -
 18
18 -
 19
19 -
 20
20 -
 21
21 -
 22
22 -
 23
23 -
 24
24 -
 25
25 -
 26
26 -
 27
27 -
 28
28 -
 29
29 -
 30
30 -
 31
31 -
32
-
33
-
34
-
35
-
36
-
37
-
38
-
39
-
40
-
41
-
42
-
43
-
44
-
45
-
46
-
47
-
48
-
49
-
50
-
51
-
52
-
53
-
54
-
55
-
56
-
57
-
58
-
59
-
60
-
61
-
62
-
63
-
64
-
65
-
66
-
67
-
68
 |
 |
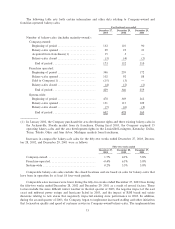
terminate the ADA and develop Company-owned locations or develop locations through new area developers
in that market.
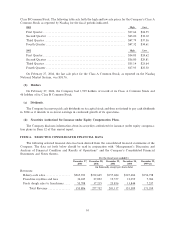
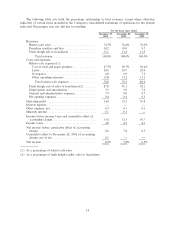
Fresh dough facility sales to franchisees increased 44.4% to $53.7 million for the Ñfty-two weeks ended
December 27, 2003 from $37.2 million for the Ñfty-two weeks ended December 28, 2002. The increase was
primarily driven by the increased number of franchise bakery-cafes opened, as well as a shift in certain product
being distributed through the fresh dough facility system rather than a third party.
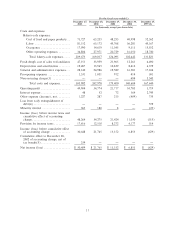
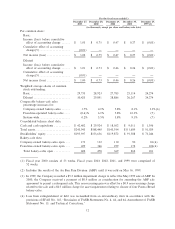
Costs and Expenses
The cost of food and paper products includes the costs associated with the fresh dough operations that sell
fresh dough products to Company-owned bakery-cafes as well as the cost of food and paper products supplied
by third party vendors and distributors. The costs associated with the fresh dough operations that sell fresh
dough products to the franchised bakery-cafes are excluded and are shown separately as fresh dough cost of
sales to franchisees in the Consolidated Statements of Operations. The cost of food and paper products
decreased to 27.7% of bakery-cafe sales for the Ñfty-two weeks ended December 27, 2003 compared to 29.7%
of bakery-cafe sales for the Ñfty-two weeks ended December 28, 2002. This decrease in the cost of food and
paper products as a percentage of bakery-cafe sales is primarily due to the Company's improved leveraging of
its fresh dough manufacturing and distribution costs as it opened more bakery-cafes in Ñscal 2003. For the
Ñfty-two weeks ended December 27, 2003, there was an average of 32.7 bakery-cafes per fresh dough facility
compared to an average of 27.3 for the Ñfty-two weeks ended December 28, 2002. Additionally, lower
ingredient costs, including the beneÑts of our new sweet goods contract that commenced during the Ñrst
quarter of Ñscal 2003, further beneÑted food cost.
Labor expense was $81.2 million, or 30.5% of bakery-cafe sales, for the Ñfty-two weeks ended
December 27, 2003 compared to $63.2 million, or 29.7% of bakery-cafe sales, for the Ñfty-two weeks ended
December 28, 2002. The labor expense as a percentage of bakery-cafe sales increased between the Ñfty-two
weeks ended December 27, 2003 and the Ñfty-two weeks ended December 28, 2002 primarily as a result of our
customer service initiatives in Ñscal 2003 related to quality and speed of service as well as table delivery service
testing and the continued commitment to training and staÇng our bakery-cafes.
Occupancy costs were $18.0 million, or 6.8% of bakery-cafe sales, for the Ñfty-two weeks ended
December 27, 2003 compared to $14.6 million, or 6.9% of bakery-cafe sales, for the Ñfty-two weeks ended
December 28, 2002. The occupancy cost as a percentage of bakery-cafe sales declined for the Ñfty-two weeks
ended December 27, 2003 due to the leveraging of these costs over higher sales volumes.
Other bakery-cafe operating expenses, which include advertising, retail Ñeld overhead, utilities, and other
cafe expenses, were $36.8 million, or 13.8% of bakery-cafe sales, for the Ñfty-two weeks ended December 27,
2003 compared to $28.0 million, or 13.2% of bakery-cafe sales, for the Ñfty-two weeks ended December 28,
2002. The increase in other bakery-cafe operating expenses as a percentage of bakery-cafe sales for the Ñfty-
two weeks ended December 27, 2003 is primarily due to increased organizational costs for Ñeld management,
costs associated with new markets opened which do not yet have multi-unit leverage, and increased recruiting
and training, repair and maintenance, and advertising costs.
For the Ñfty-two weeks ended December 27, 2003, fresh dough facility cost of sales to franchisees was
$47.2 million, or 87.8% of fresh dough facility sales to franchisees, compared to $34.0 million, or 91.3% of
fresh dough facility sales to franchisees, for the Ñfty-two weeks ended December 28, 2002. The decrease in the
fresh dough cost of sales rate in Ñscal 2003 was primarily due to favorable ingredient costs and the impact of
the favorable change in our sweet goods supply agreement, which took eÅect during the Ñrst quarter of Ñscal
2003.
Depreciation and amortization was $19.5 million, or 5.5% of total revenue, for the Ñfty-two weeks ended
December 27, 2003 compared to $14.0 million, or 5.0% of total revenue, for the Ñfty-two weeks ended
December 28, 2002. The increase in depreciation and amortization as a percentage of total revenue for the
Ñfty-two weeks ended December 27, 2003 compared to the Ñfty-two weeks ended December 28, 2002 is
17