Panera Bread 2003 Annual Report Download - page 16
Download and view the complete annual report
Please find page 16 of the 2003 Panera Bread annual report below. You can navigate through the pages in the report by either clicking on the pages listed below, or by using the keyword search tool below to find specific information within the annual report.-
 1
1 -
2
-
3
-
4
-
5
-
 6
6 -
 7
7 -
 8
8 -
 9
9 -
 10
10 -
 11
11 -
 12
12 -
 13
13 -
 14
14 -
 15
15 -
 16
16 -
 17
17 -
 18
18 -
 19
19 -
 20
20 -
 21
21 -
 22
22 -
 23
23 -
 24
24 -
 25
25 -
 26
26 -
27
-
28
-
29
-
30
-
31
-
32
-
33
-
34
-
35
-
36
-
37
-
38
-
39
-
40
-
41
-
42
-
43
-
44
-
45
-
46
-
47
-
48
-
49
-
50
-
51
-
52
-
53
-
54
-
55
-
56
-
57
-
58
-
59
-
60
-
61
-
62
-
63
-
64
-
65
-
66
-
67
-
68
 |
 |

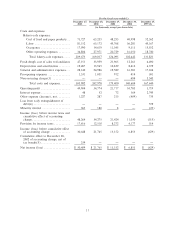
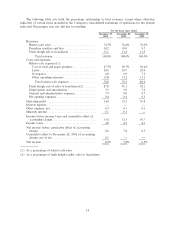
For the Ñscal years ended(1)
December 27, December 28, December 29, December 30, December 25,
2003 2002 2001 2000 1999(2)
(in thousands, except per share and bakery-cafe data)
Per common share:
Basic:
Income (loss) before cumulative
eÅect of accounting change ÏÏÏÏÏÏ $ 1.03 $ 0.75 $ 0.47 $ 0.27 $ (0.03)
Cumulative eÅect of accounting
change(5)ÏÏÏÏÏÏÏÏÏÏÏÏÏÏÏÏÏÏÏÏÏ (0.01) Ì Ì Ì Ì
Net income (loss)ÏÏÏÏÏÏÏÏÏÏÏÏÏÏÏÏ $ 1.02 $ 0.75 $ 0.47 $ 0.27 $ (0.03)
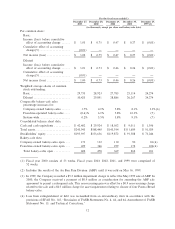
Diluted:
Income (loss) before cumulative
eÅect of accounting change ÏÏÏÏÏÏ $ 1.01 $ 0.73 $ 0.46 $ 0.26 $ (0.03)
Cumulative eÅect of accounting
change(5)ÏÏÏÏÏÏÏÏÏÏÏÏÏÏÏÏÏÏÏÏÏ (0.01) Ì Ì Ì Ì
Net income (loss)ÏÏÏÏÏÏÏÏÏÏÏÏÏÏÏÏ $ 1.00 $ 0.73 $ 0.46 $ 0.26 $ (0.03)
Weighted average shares of common
stock outstanding:
Basic ÏÏÏÏÏÏÏÏÏÏÏÏÏÏÏÏÏÏÏÏÏÏÏÏÏÏÏ 29,733 28,923 27,783 25,114 24,274
Diluted ÏÏÏÏÏÏÏÏÏÏÏÏÏÏÏÏÏÏÏÏÏÏÏÏÏ 30,423 29,891 28,886 26,267 24,274
Comparable bakery-cafe sales
percentage increases for:
Company-owned bakery-cafes ÏÏÏÏÏÏ 1.7% 4.1% 5.8% 8.1% 3.3%(6)
Franchise-operated bakery-cafes ÏÏÏÏ (0.4)% 6.1% 5.8% 10.3% (7)
System-wideÏÏÏÏÏÏÏÏÏÏÏÏÏÏÏÏÏÏÏÏÏ 0.2% 5.5% 5.8% 9.1% (7)
Consolidated balance sheet data:
Cash and cash equivalents ÏÏÏÏÏÏÏÏÏÏÏ $ 42,402 $ 29,924 $ 18,052 $ 9,011 $ 1,936
Total assetsÏÏÏÏÏÏÏÏÏÏÏÏÏÏÏÏÏÏÏÏÏÏÏÏ $245,943 $188,440 $143,934 $111,689 $ 91,029
Stockholders' equity ÏÏÏÏÏÏÏÏÏÏÏÏÏÏÏÏ $195,937 $153,656 $119,872 $ 91,588 $ 73,246
Bakery-cafe data:
Company-owned bakery-cafes open ÏÏÏ 173 132 110 90 81(6)
Franchise-owned bakery-cafes open ÏÏÏ 429 346 259 172 100(6)
Total bakery-cafes open ÏÏÏÏÏÏÏÏÏÏÏ 602 478 369 262 181
(1) Fiscal year 2000 consists of 53 weeks. Fiscal years 2003, 2002, 2001, and 1999 were comprised of
52 weeks.
(2) Includes the results of the Au Bon Pain Division (ABP) until it was sold on May 16, 1999.
(3) In 1999, the Company recorded a $5.5 million impairment charge to reÖect the May 1999 sale of ABP. In
2000, the Company received a payment of $0.9 million as consideration for amending the ABP sale
agreement to permit a subsequent sale. This non-recurring gain was oÅset by a $0.9 non-recurring charge
related to the sale and a $0.5 million charge for asset impairment relating to closure of four Panera Bread
bakery-cafes.
(4) Loss from extinguishment of debt was reclassiÑed from an extraordinary item in accordance with the
provisions of SFAS No. 145, ""Rescission of FASB Statements No. 4, 44, and 64, Amendment of FASB
Statement No. 13, and Technical Corrections.''
12