Panera Bread 2003 Annual Report Download - page 57
Download and view the complete annual report
Please find page 57 of the 2003 Panera Bread annual report below. You can navigate through the pages in the report by either clicking on the pages listed below, or by using the keyword search tool below to find specific information within the annual report.-
 1
1 -
2
-
3
-
4
-
5
-
6
-
7
-
8
-
9
-
10
-
11
-
12
-
13
-
14
-
15
-
16
-
17
-
18
-
19
-
20
-
21
-
22
-
23
-
24
-
25
-
26
-
27
-
28
-
29
-
30
-
31
-
32
-
33
-
34
-
35
-
36
-
37
-
38
-
39
-
40
-
41
-
42
-
43
-
44
-
45
-
46
-
 47
47 -
 48
48 -
 49
49 -
 50
50 -
 51
51 -
 52
52 -
 53
53 -
 54
54 -
 55
55 -
 56
56 -
 57
57 -
 58
58 -
 59
59 -
 60
60 -
 61
61 -
 62
62 -
 63
63 -
 64
64 -
 65
65 -
 66
66 -
 67
67 -
68
 |
 |

PANERA BREAD COMPANY
NOTES TO THE CONSOLIDATED FINANCIAL STATEMENTS Ì (Continued)
December 27, December 28, December 29,
2003 2002 2001
(in thousands)
Depreciation and amortization:
Company bakery-cafe operations ÏÏÏÏÏÏÏÏÏÏÏÏÏÏÏÏÏÏÏÏÏÏÏÏÏ $ 12,995 $ 9,243 $ 6,620
Fresh dough operations ÏÏÏÏÏÏÏÏÏÏÏÏÏÏÏÏÏÏÏÏÏÏÏÏÏÏÏÏÏÏÏÏÏ 3,742 2,387 1,316
Corporate administrationÏÏÏÏÏÏÏÏÏÏÏÏÏÏÏÏÏÏÏÏÏÏÏÏÏÏÏÏÏÏÏÏ 2,750 2,335 2,903
Total depreciation and amortization ÏÏÏÏÏÏÏÏÏÏÏÏÏÏÏÏÏÏÏÏ $ 19,487 $ 13,965 $ 10,839
Capital expenditures:
Company bakery-cafe operations ÏÏÏÏÏÏÏÏÏÏÏÏÏÏÏÏÏÏÏÏÏÏÏÏÏ $ 29,082 $ 15,349 $ 18,418
Fresh dough operations ÏÏÏÏÏÏÏÏÏÏÏÏÏÏÏÏÏÏÏÏÏÏÏÏÏÏÏÏÏÏÏÏÏ 8,384 9,971 5,895
Corporate administrationÏÏÏÏÏÏÏÏÏÏÏÏÏÏÏÏÏÏÏÏÏÏÏÏÏÏÏÏÏÏÏÏ 3,721 1,799 3,215
Total capital expenditures ÏÏÏÏÏÏÏÏÏÏÏÏÏÏÏÏÏÏÏÏÏÏÏÏÏÏÏÏÏ $ 41,187 $ 27,119 $ 27,528
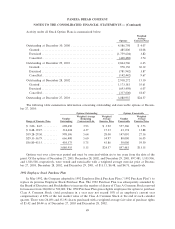
17. Earnings Per Share
The following table sets forth the computation of basic and diluted earnings per share (in thousands,
except for per share data) as adjusted for the two-for-one stock split in June 2002:
For the Ñscal years ended
December 27, December 28, December 29,
2003 2002 2001
Amounts used for basic and diluted per share
calculations:
Income before cumulative eÅect of accounting change $30,648 $21,765 $13,152
Cumulative eÅect of accounting change, net of taxÏÏÏÏ (239) Ì Ì
Net incomeÏÏÏÏÏÏÏÏÏÏÏÏÏÏÏÏÏÏÏÏÏÏÏÏÏÏÏÏÏÏÏÏÏÏÏÏÏ $30,409 $21,765 $13,152
Weighted average number of shares outstanding Ì
basic ÏÏÏÏÏÏÏÏÏÏÏÏÏÏÏÏÏÏÏÏÏÏÏÏÏÏÏÏÏÏÏÏÏÏÏÏÏÏÏÏ 29,733 28,923 27,783
EÅect of dilutive securities:
Employee stock optionsÏÏÏÏÏÏÏÏÏÏÏÏÏÏÏÏÏÏÏÏÏÏÏÏÏ 690 968 1,103
Weighted average number of shares outstanding Ì
diluted ÏÏÏÏÏÏÏÏÏÏÏÏÏÏÏÏÏÏÏÏÏÏÏÏÏÏÏÏÏÏÏÏÏÏÏÏÏÏÏ 30,423 29,891 28,886
Basic earnings per common share:
Before cumulative eÅect of accounting change ÏÏÏÏÏÏÏ $ 1.03 $ 0.75 $ 0.47
Cumulative eÅect of accounting change ÏÏÏÏÏÏÏÏÏÏÏÏÏ (0.01) Ì Ì
Net incomeÏÏÏÏÏÏÏÏÏÏÏÏÏÏÏÏÏÏÏÏÏÏÏÏÏÏÏÏÏÏÏÏÏÏÏÏÏ $ 1.02 $ 0.75 $ 0.47
Diluted earnings per common share:
Before cumulative eÅect of accounting change ÏÏÏÏÏÏÏ $ 1.01 $ 0.73 $ 0.46
Cumulative eÅect of accounting change ÏÏÏÏÏÏÏÏÏÏÏÏÏ (0.01) Ì Ì
Net incomeÏÏÏÏÏÏÏÏÏÏÏÏÏÏÏÏÏÏÏÏÏÏÏÏÏÏÏÏÏÏÏÏÏÏÏÏÏ $ 1.00 $ 0.73 $ 0.46
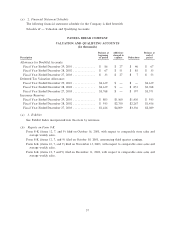
For the years ended December 27, 2003, December 28, 2002, and December 29, 2001, outstanding
options for 0.4 million, 0.3 million, and 0.3 million shares, respectively, were excluded in calculating diluted
53