Panera Bread 2003 Annual Report Download - page 25
Download and view the complete annual report
Please find page 25 of the 2003 Panera Bread annual report below. You can navigate through the pages in the report by either clicking on the pages listed below, or by using the keyword search tool below to find specific information within the annual report.-
 1
1 -
2
-
3
-
4
-
5
-
6
-
7
-
8
-
9
-
10
-
11
-
12
-
13
-
14
-
 15
15 -
 16
16 -
 17
17 -
 18
18 -
 19
19 -
 20
20 -
 21
21 -
 22
22 -
 23
23 -
 24
24 -
 25
25 -
 26
26 -
 27
27 -
 28
28 -
 29
29 -
 30
30 -
 31
31 -
 32
32 -
 33
33 -
 34
34 -
 35
35 -
36
-
37
-
38
-
39
-
40
-
41
-
42
-
43
-
44
-
45
-
46
-
47
-
48
-
49
-
50
-
51
-
52
-
53
-
54
-
55
-
56
-
57
-
58
-
59
-
60
-
61
-
62
-
63
-
64
-
65
-
66
-
67
-
68
 |
 |
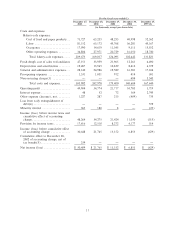
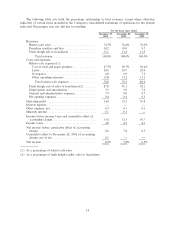
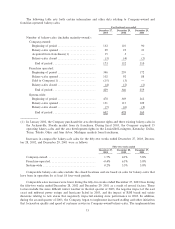
dough facility cost of sales rate was primarily due to the lower cost of butter between 2002 and 2001. The
average price of butter per pound decreased 23.7% to $1.32 per pound from $1.73 per pound for the Ñfty-two
weeks ended December 28, 2002. This was oÅset in part by the increased cost of product purchased under the
Bunge Foods sweet goods contract. The Company entered into a Ñve-year supply agreement for sweet goods in
1998 with Bunge Foods Corporation (""Bunge''). The Company's pricing for years one through four of the
contract was at Bunge's cost plus 18.07%. In year Ñve of the contract, beginning in March of 2002, pricing
changed to Bunge's cost plus 36.0%. The Company charges a transfer price of 22.1% of retail price of the
underlying product to both Company-owned and franchise-operated bakery-cafes. The cost diÅerential
(diÅerence between the price charged to the Company by Bunge and the transfer price charged by the
Company to Company-owned and franchise-operated bakery-cafes) results in a proÑt or loss to the Company
which is allocated to cost of food and paper products and fresh dough facility cost of sales to franchisees on the
Company's Consolidated Statement of Operations based on the number of Company-owned or franchise-
operated bakery-cafes to the total system.
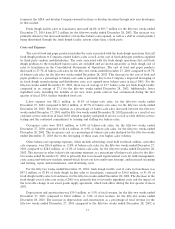
Depreciation and amortization was $14.0 million or 5.0% of total revenue for the Ñfty-two weeks ended
December 28, 2002 compared to $10.8 million or 5.4% of total revenue for the Ñfty-two weeks ended
December 29, 2001. The improvement in depreciation and amortization as a percentage of total revenue for
the Ñfty-two weeks ended December 28, 2002 compared to the Ñfty-two weeks ended December 29, 2001,
respectively, is primarily due to the leveraging of higher bakery-cafe sales volume and the Company's adoption
of SFAS No. 142. Amortization expense decreased $1.0 million for the Ñfty-two weeks ended December 28,
2002, compared to the Ñfty-two weeks ended December 29, 2001 as a result of the elimination of goodwill
amortization following the adoption of SFAS No. 142.
General and administrative expenses were $25.0 million or 9.0% of total revenue, and $19.6 million or
9.7% of total revenue for the Ñfty-two weeks ended December 28, 2002 and December 29, 2001, respectively.
The decrease in the general and administrative expense rate between 2002 and 2001 results primarily from
higher revenues, which help leverage general and administrative expenses.
Pre-opening expenses, which consist primarily of labor costs and food costs, were $1.1 million or 0.4% of
revenues in the Ñfty-two weeks ended December 28, 2002, compared to $0.9 million or 0.5% of sales in the
Ñfty-two weeks ended December 29, 2001. There were 23 bakery-cafes opened during the Ñfty-two weeks
ended December 28, 2002, compared to 21 bakery-cafe openings for the Ñfty-two weeks ended December 29,
2001.
Operating ProÑt
Operating proÑt for the Ñfty-two weeks ended December 28, 2002 increased to $34.8 million or 12.5% of
total revenue from $21.7 million or 10.8% of total revenue for the Ñfty-two weeks ended December 29, 2001.
Operating proÑt for the Ñfty-two weeks ended December 28, 2002 rose as a result of the factors described
above.
Minority Interest
Minority interest represents the portion of the Company's operating proÑt that is attributable to the
ownership interest of our minority interest owner in the Northern Virginia/Central Pennsylvania area.
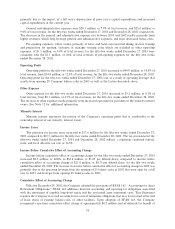
Income Taxes
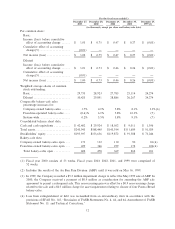
The provision for income taxes increased to $12.5 million for the Ñfty-two weeks ended December 28,
2002 compared to $8.3 million for the Ñfty-two weeks ended December 29, 2001. The tax provisions for the
Ñfty-two weeks ended December 28, 2002 and December 29, 2001, reÖect a combined federal, state, and local
eÅective tax rate of 36.5% and 38.6%, respectively. The reduction in the eÅective tax rate for the Ñfty-two
weeks ended December 28, 2002 as compared to the Ñfty-two weeks ended December 29, 2001, results from
the Company's restructuring of its legal entities to better manage its intellectual property which has resulted in
a lower eÅective state income tax rate.
21