Panera Bread 2003 Annual Report Download - page 24
Download and view the complete annual report
Please find page 24 of the 2003 Panera Bread annual report below. You can navigate through the pages in the report by either clicking on the pages listed below, or by using the keyword search tool below to find specific information within the annual report.
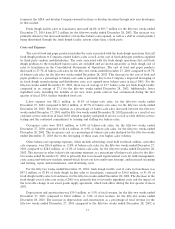
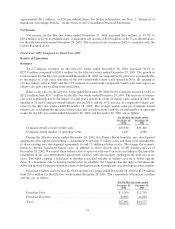
The increase in royalty revenue can be attributed to the impact of a full year's operations of the 88
franchised bakery-cafes opened in 2001, the addition of 92 franchised bakery-cafes in 2002, and a 6.1%
increase in comparable franchised bakery-cafe sales (excluding the specialty bakery-cafe and closed
locations) for the Ñfty-two weeks ended December 28, 2002. The average weekly sales per franchise-operated
bakery-cafe (excluding the specialty bakery-cafe and closed locations) and the related number of operating
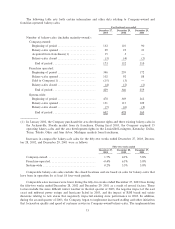
weeks for the Ñfty-two weeks ended December 28, 2002 and December 29, 2001 are as follows:
For the Ñfty-two weeks ended
December 28, December 29,
2002 2001
Franchise average weekly sales ÏÏÏÏÏÏÏÏÏÏÏÏÏÏÏÏÏÏÏÏÏÏÏÏÏÏÏÏÏÏÏÏÏ $35,997 $34,607
Franchise number of operating weeks ÏÏÏÏÏÏÏÏÏÏÏÏÏÏÏÏÏÏÏÏÏÏÏÏÏÏÏ 15,068 10,735
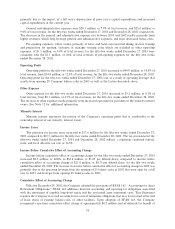
Fresh dough facility sales to franchisees increased 55.6% to $37.2 million for the Ñfty-two weeks ended
December 28, 2002 from $23.9 million for the Ñfty-two weeks ended December 29, 2001. The increase was
primarily driven by the growth in comparable franchise-operated bakery-cafe sales and the increased number
of franchise-operated bakery-cafes described above.
Costs and Expenses
The cost of food and paper products includes the costs associated with the fresh dough facility operations
that sell fresh dough products to Company-owned bakery-cafes as well as the cost of food and paper products
supplied by third party vendors and distributors. The costs associated with the fresh dough facility operations
that sell fresh dough products to the franchised bakery-cafes are excluded and are shown separately as fresh
dough facility cost of sales to franchisees in the Consolidated Statements of Operations. The cost of food and
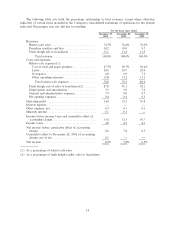
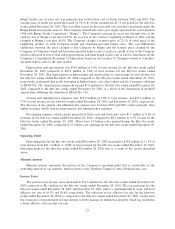
paper products decreased to 29.7% of bakery-cafe sales for the Ñfty-two weeks ended December 28, 2002,
compared to 30.6% of bakery-cafe sales for the Ñfty-two weeks ended December 29, 2001. For the Ñfty-two
weeks ended December 28, 2002, there was an average of 27.3 bakery-cafes per fresh dough facility compared
to an average of 22.6 for the Ñfty-two weeks ended December 29, 2001. This results in greater manufacturing
and distribution eÇciencies and a reduction of costs as a percentage of bakery-cafe sales. Additionally, food
cost improvements resulted from better utilization of information provided by our information technology
systems to manage food costs at the bakery-cafe. These eÇciencies were oÅset in part by ineÇciencies
associated with the artisan bread roll out and the higher cost of Öour.
Labor expense was $63.2 million or 29.7% of bakery-cafe sales for the Ñfty-two weeks ended Decem-
ber 28, 2002 compared to $45.8 million or 29.0% of bakery-cafe sales for the Ñfty-two weeks ended
December 29, 2001. The labor expense as a percentage of bakery-cafe sales increased between the Ñfty-two
weeks ended December 28, 2002 and the Ñfty-two weeks ended December 29, 2001 primarily as a result of
increased average manager and crew staÇng levels associated with our commitment to having fully staÅed
bakery-cafes. This also increased training costs associated with our centralized training programs. Addition-
ally, health insurance costs increased on a year over year basis.
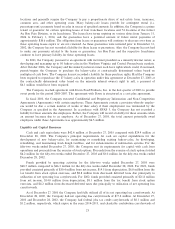
Occupancy costs were $14.6 million or 6.9% of bakery-cafe sales for the Ñfty-two weeks ended
December 28, 2002 compared to $11.3 million or 7.2% of bakery-cafe sales for the Ñfty-two weeks ended
December 29, 2001. The occupancy cost as a percentage of bakery-cafe sales declined for the Ñfty-two weeks
ended December 28, 2002, due to the leveraging of these costs over higher sales volumes.
Other bakery-cafe operating expenses, which include advertising, retail Ñeld overhead, utilities, and other
cafe expenses, were $28.0 million or 13.2% of bakery-cafe sales for the Ñfty-two weeks ended December 28,
2002 compared to $20.7 million or 13.1% of bakery-cafe sales for the Ñfty-two weeks ended December 29,
2001. The increase in other bakery-cafe operating expenses as a percentage of bakery-cafe sales for the Ñfty-
two weeks ended December 28, 2002 is primarily due to an increase in advertising expenses.
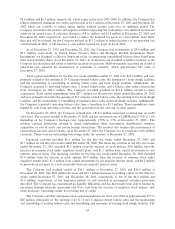
For the Ñfty-two weeks ended December 28, 2002, fresh dough facility cost of sales to franchisees was
$34.0 million or 91.3% of fresh dough facility sales to franchisees compared to $22.0 million or 92.1% of fresh
dough facility sales to franchisees for the Ñfty-two weeks ended December 29, 2001. The decrease in the fresh
20


